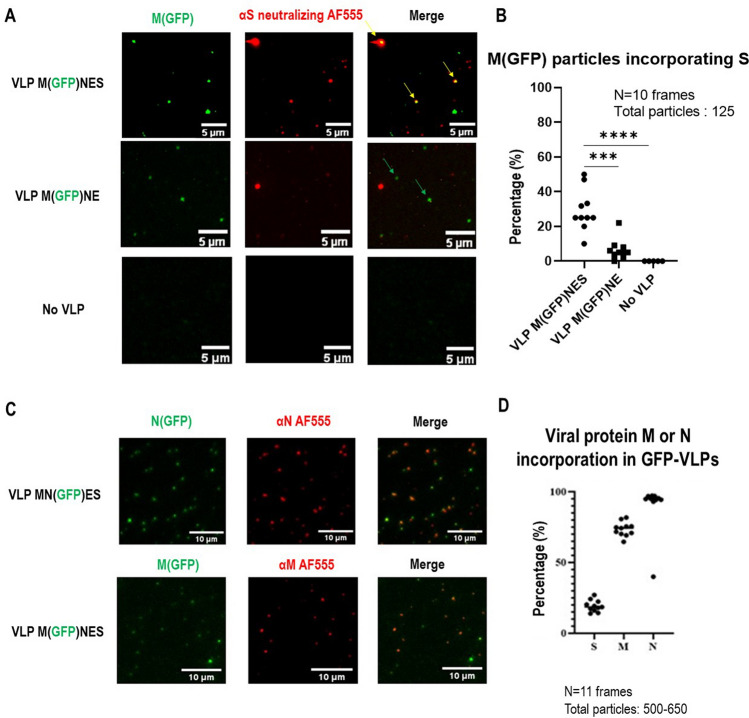
Figure 4.
Evaluation of the incorporation of the Spike S, N and M in fluorescent SARS-CoV-2 VLPs using immuno-spotting coupled to TIRF-Microscopy. (A) TIRF images of M(GFP)NES VLPs, M(GFP)NE VLPs and control. An anti-S antibody coupled to a AF555 secondary antibody was used for S immunolabeling. Yellow arrows show the anti-S antibody-AF555 bound to VLPs-(GFP). Green arrows show VLPs-(GFP). Red arrows show antibody-labeled VLPs. The scale bar is 5 µm. (B) Percentage of S incorporation in M(GFP)NES versus M(GFP)NE and the control (no VLP). For each condition, 125 fluorescent particles were counted over 10 images (frames). One dot in the graph represents the % of S incorporation in the fluorescent VLP(M-GFP), i.e. % of colocalization in each frame. The t-test was calculated and the p-value between VLP M(GFP)NES and VLP M(GFP)NE is 0.0001 and p-value between VLP M(GFP)NES and No VLP is < 0.0001. (C) Images of SARS-CoV-2 M(GFP)NES and MN(GFP)ES VLPs as revealed by immuno-spotting coupled to TIRF-M, showing N or M incorporation in the MN(GFP)ES or M(GFP)NES VLP respectively with an anti-N or anti-M antibody coupled with an Alexa555 labeled secondary antibody, as indicated. The scale bar is 10 µm. (D) Quantification of the incorporation (%) of S, M or N on respective GFP-VLPs. N = 2, 11 images per sample and the number of particles counted was between 500 and 650 for each condition.

