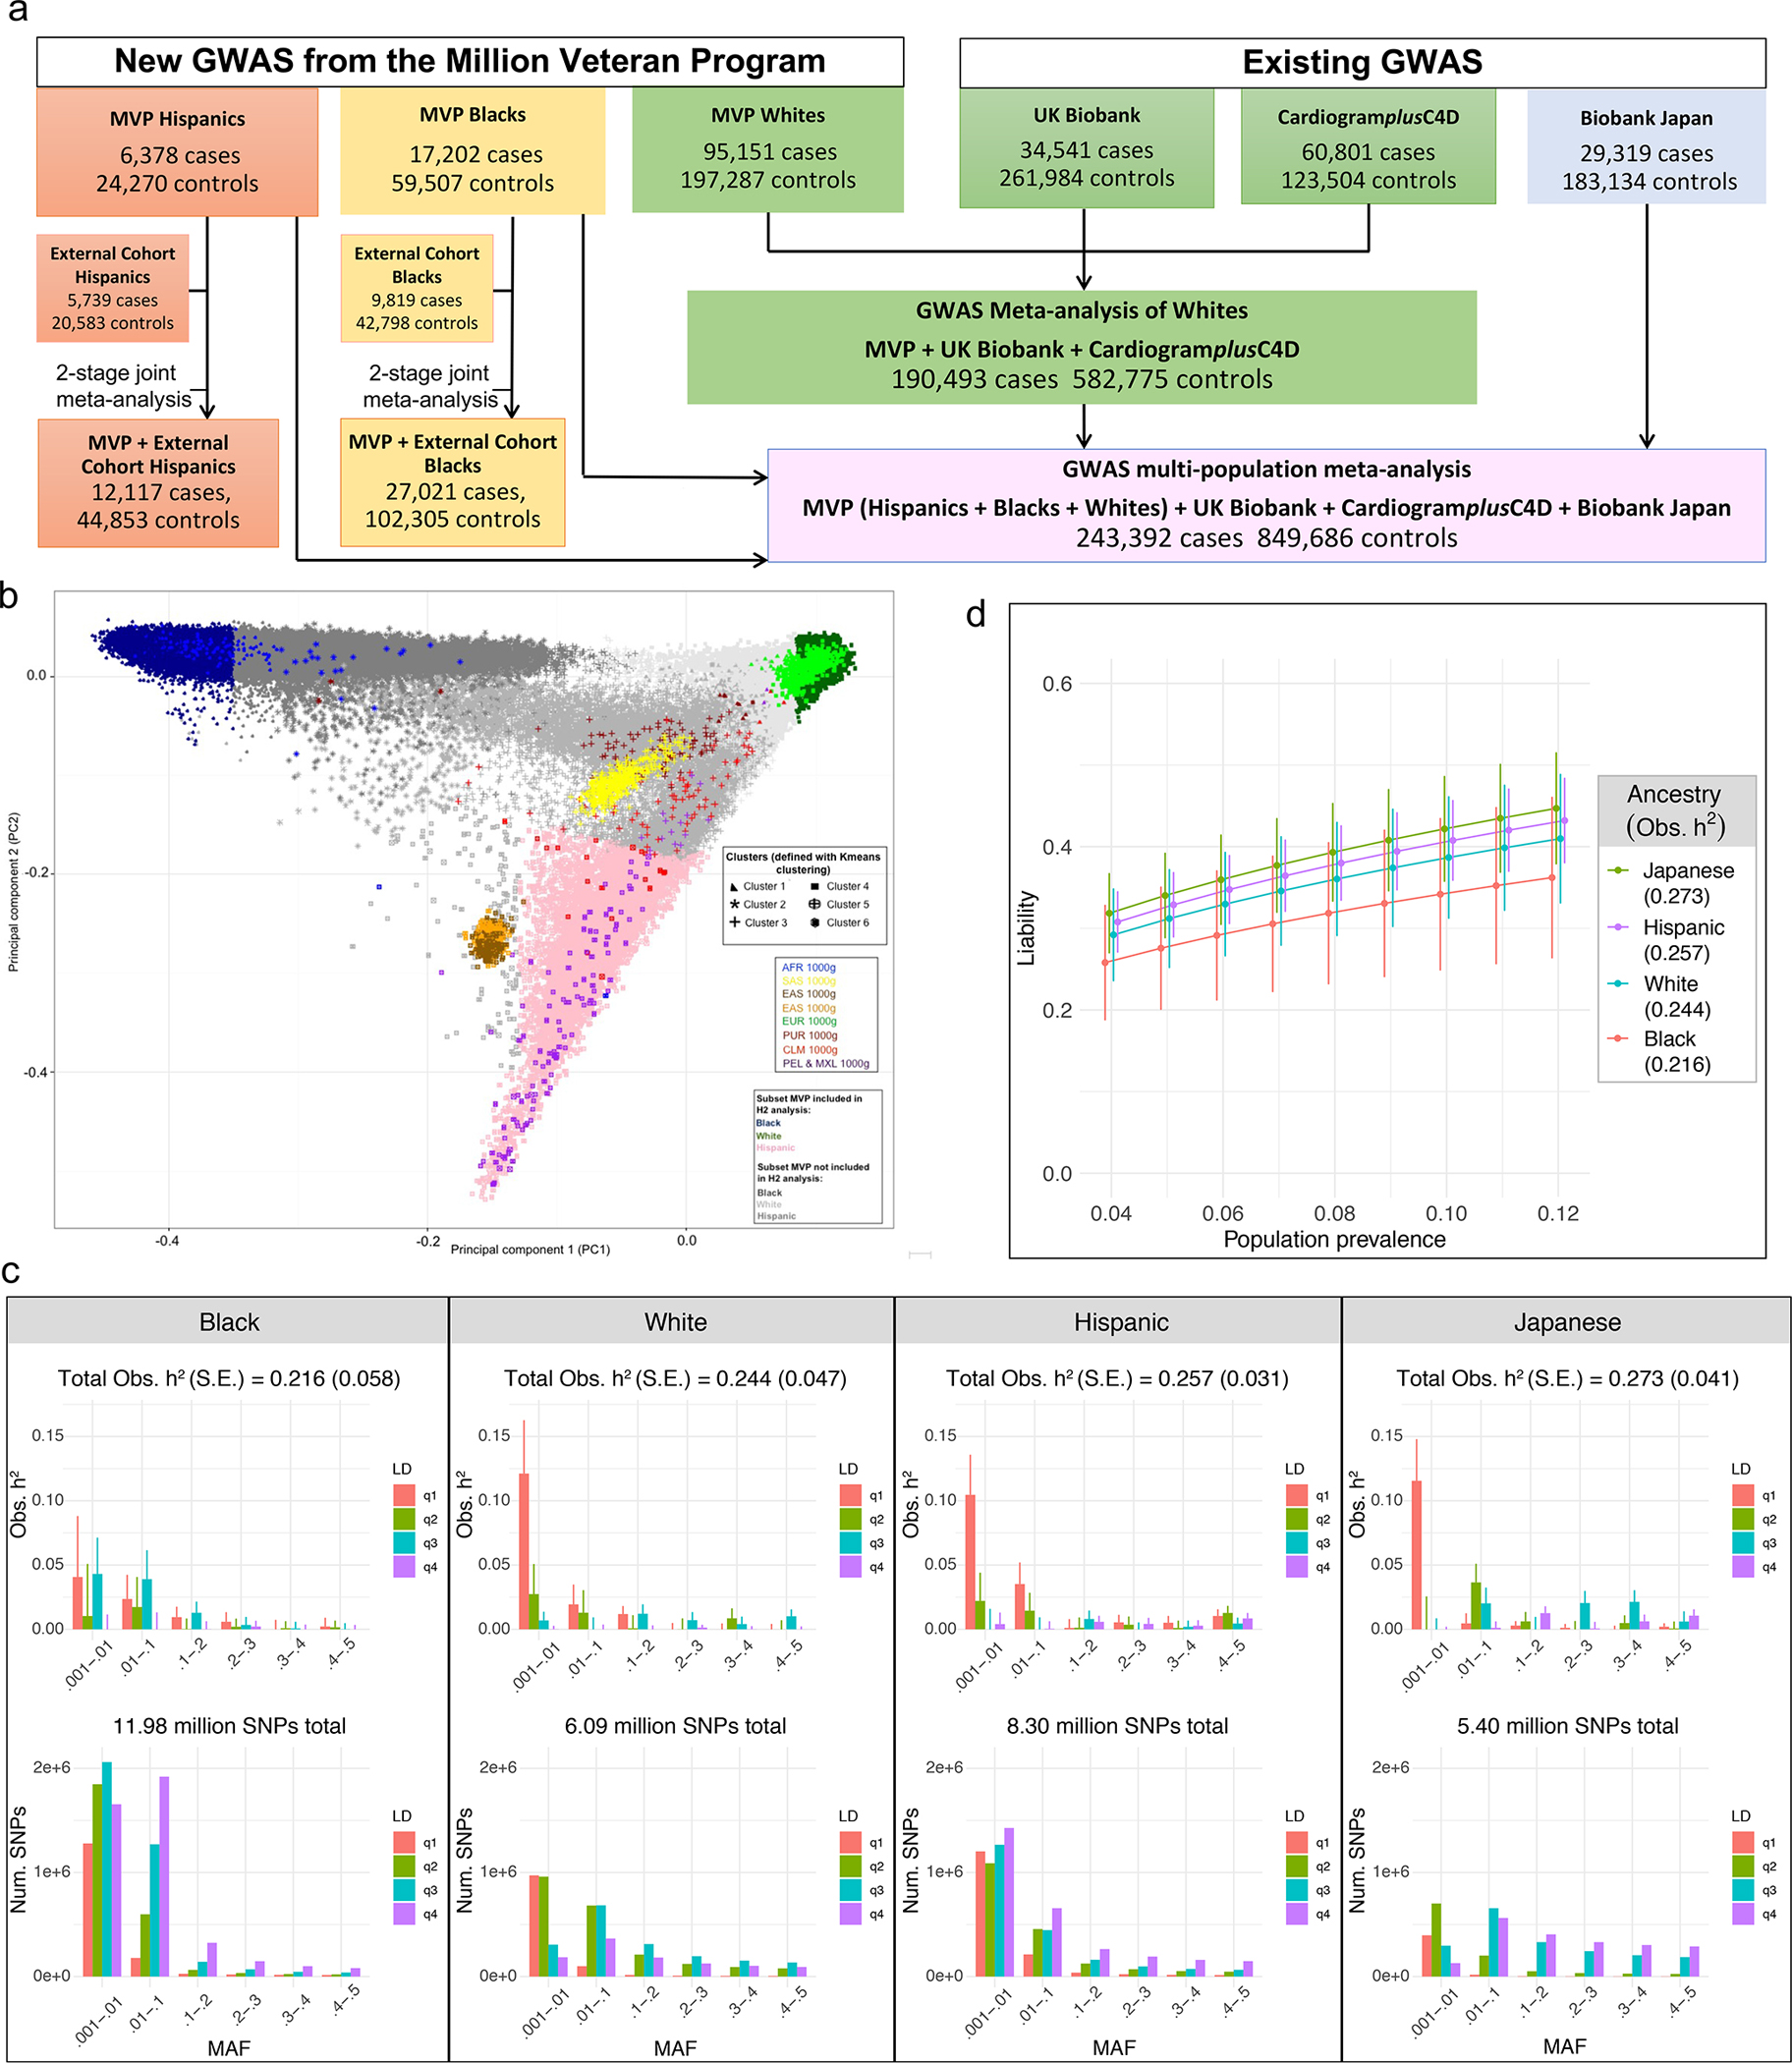
Fig. 1: Design of multi-population genome wide association study (GWAS) of coronary artery disease (CAD) and estimates of heritability (h2) of CAD using GREML-LDMS-I for four populations.

a, Study design. GWAS was first performed stratified by population group. GWAS for Whites was then meta-analyzed with 2 existing GWAS for initial discovery among Whites. The GWAS for MVP Hispanics and MVP Blacks as well as the Biobank Japan GWAS of CAD was further incorporated into a single multi-population meta-analysis. Two-stage joint meta-analysis of the most promising SNPs was performed for the Hispanics and Blacks with multiple external cohorts for population-specific discovery. b-d, Heritability (h2) analyses for CAD in four major racial groups using GREML-LDMS-I. b. Principal component analysis of MVP participants combined with 1000 genomes was first performed to identify a random subset of 19,395 Hispanics with the highest proportion of Indigenous American ancestry (pink). A random subset of the 19,392 least admixed Whites (dark green) and the 19,392 least admixed Blacks (dark blue), respectively, were then matched 1:1 on case-control status, age of first EHR evidence of CAD, type of CAD presentation, and age of controls to the Hispanics. Similar matching was performed for 18,747 participants from the Biobank Japan study. c, Observed narrow-sense h2 within each cohort defined in b using a multi-component model, GREML-LDMS-I, implemented in GCTA, with age, sex, and a genetic relatedness matrix as covariates. h2 estimate and respective standard error (SE) of that estimate is shown for each of 24 bins of imputed SNPs defined by linkage disequilibrium score quartiles and six minor allele frequency thresholds (top panel) with the corresponding absolute number of SNPs contributing to this h2 shown on the bottom panel. Total h2 is calculated by summing 24 estimates with SE for this estimate calculated by delta method. d, h2 on the liability scale for each population in c as a function of a range of presumed population prevalence of CAD. Error bars denote +/− one SE around each point estimate.
