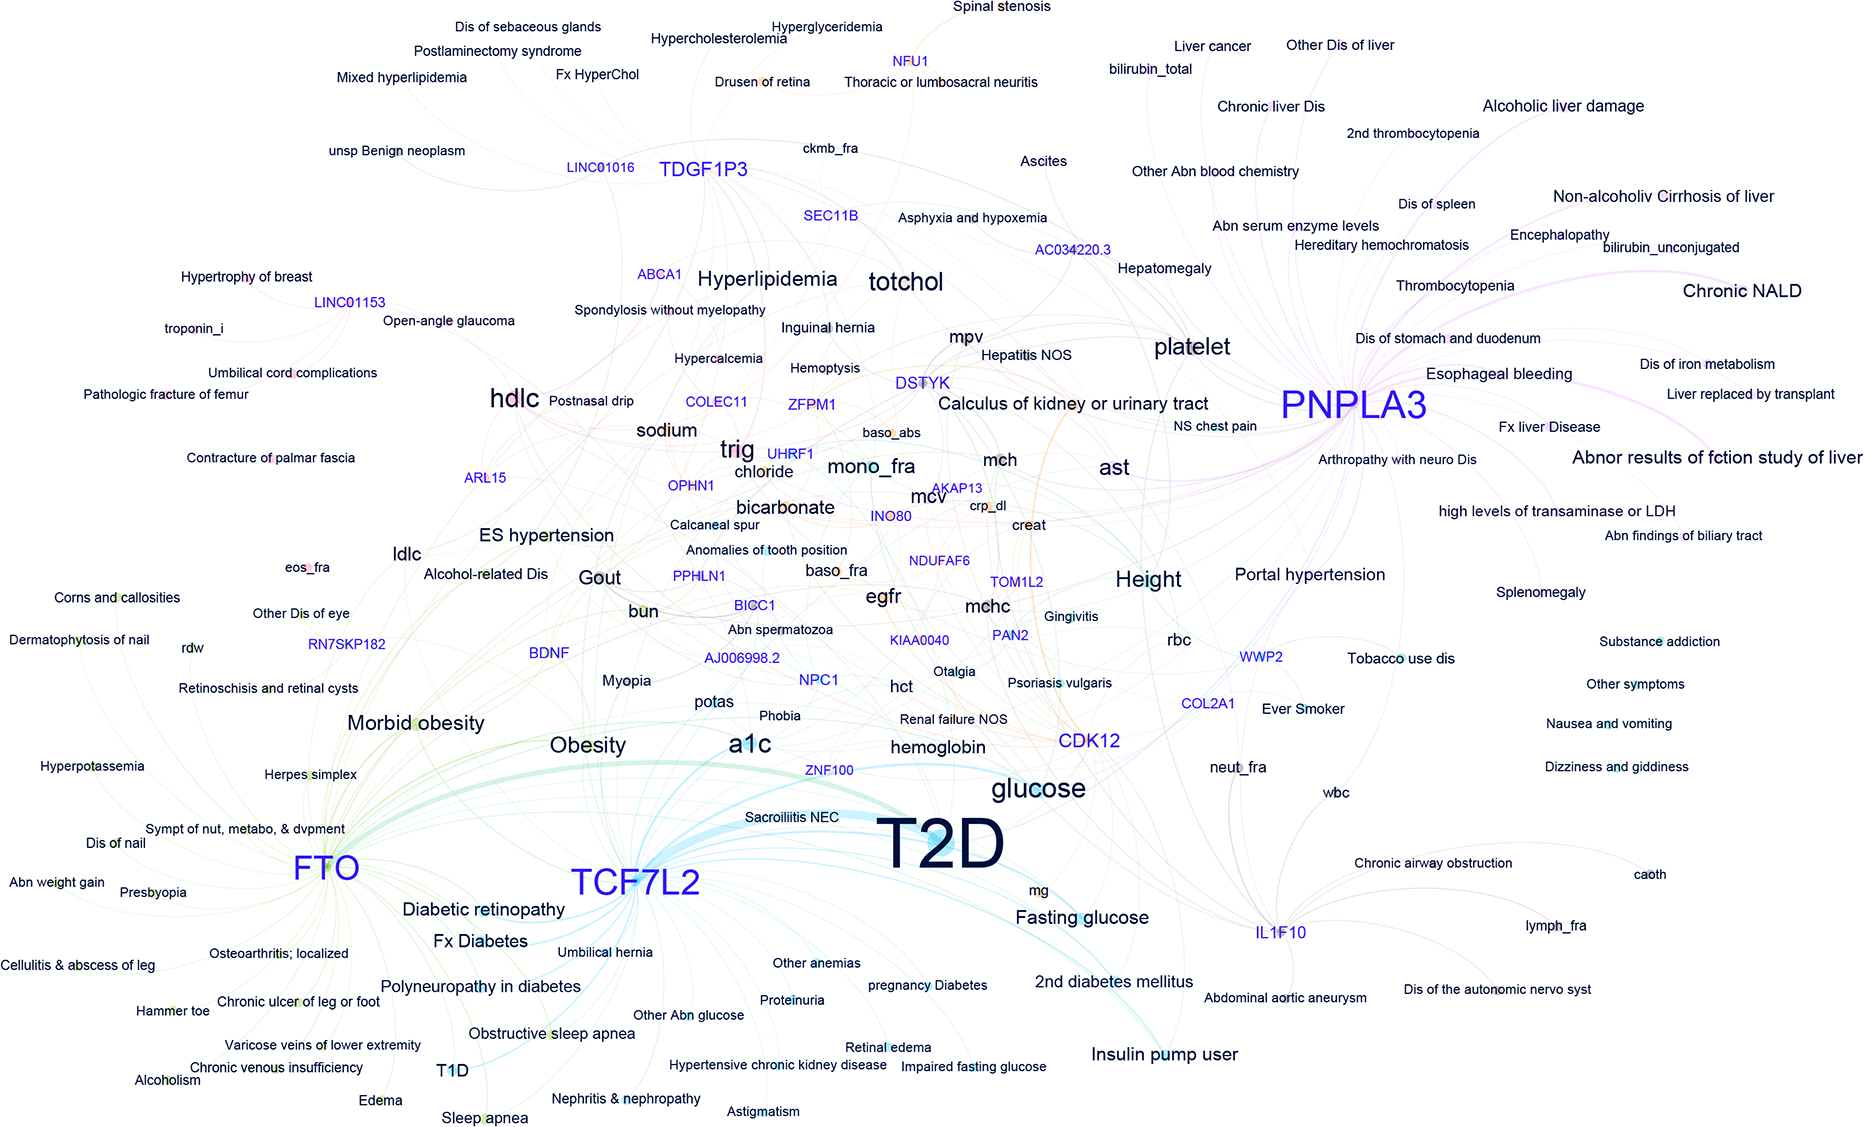
Fig. 4: Pleiotropic assessment of 95 novel loci through extended phenome wide association of lead SNPs.

Network plot of genotype-phenotype associations reaching significance at FDR<0.05 among 194,022 White participants in MVP without CAD for the lead SNPs in the 95 novel loci. Nodes are labelled either with the mapped gene for a lead SNP (purple font) or a phenotype tested in the PheWAS (black font). To highlight most pleiotropic SNPs and facilitate interpretation, the plot is restricted to lead SNPs associated with at least three distinct phenotypes. Distinct colors of nodes and edges represent a group of genotypes and phenotypes in the same dominant network. The thickness of the edges is correlated with the strength of the SNP-phenotype association (z-score). The size of the labels is dictated by the number of connections to phenotypes or genes and the strength of association. Network plot was created using Yifan Yu proportional and Atlas 2 layout algorithms as implemented in Gephi software.
