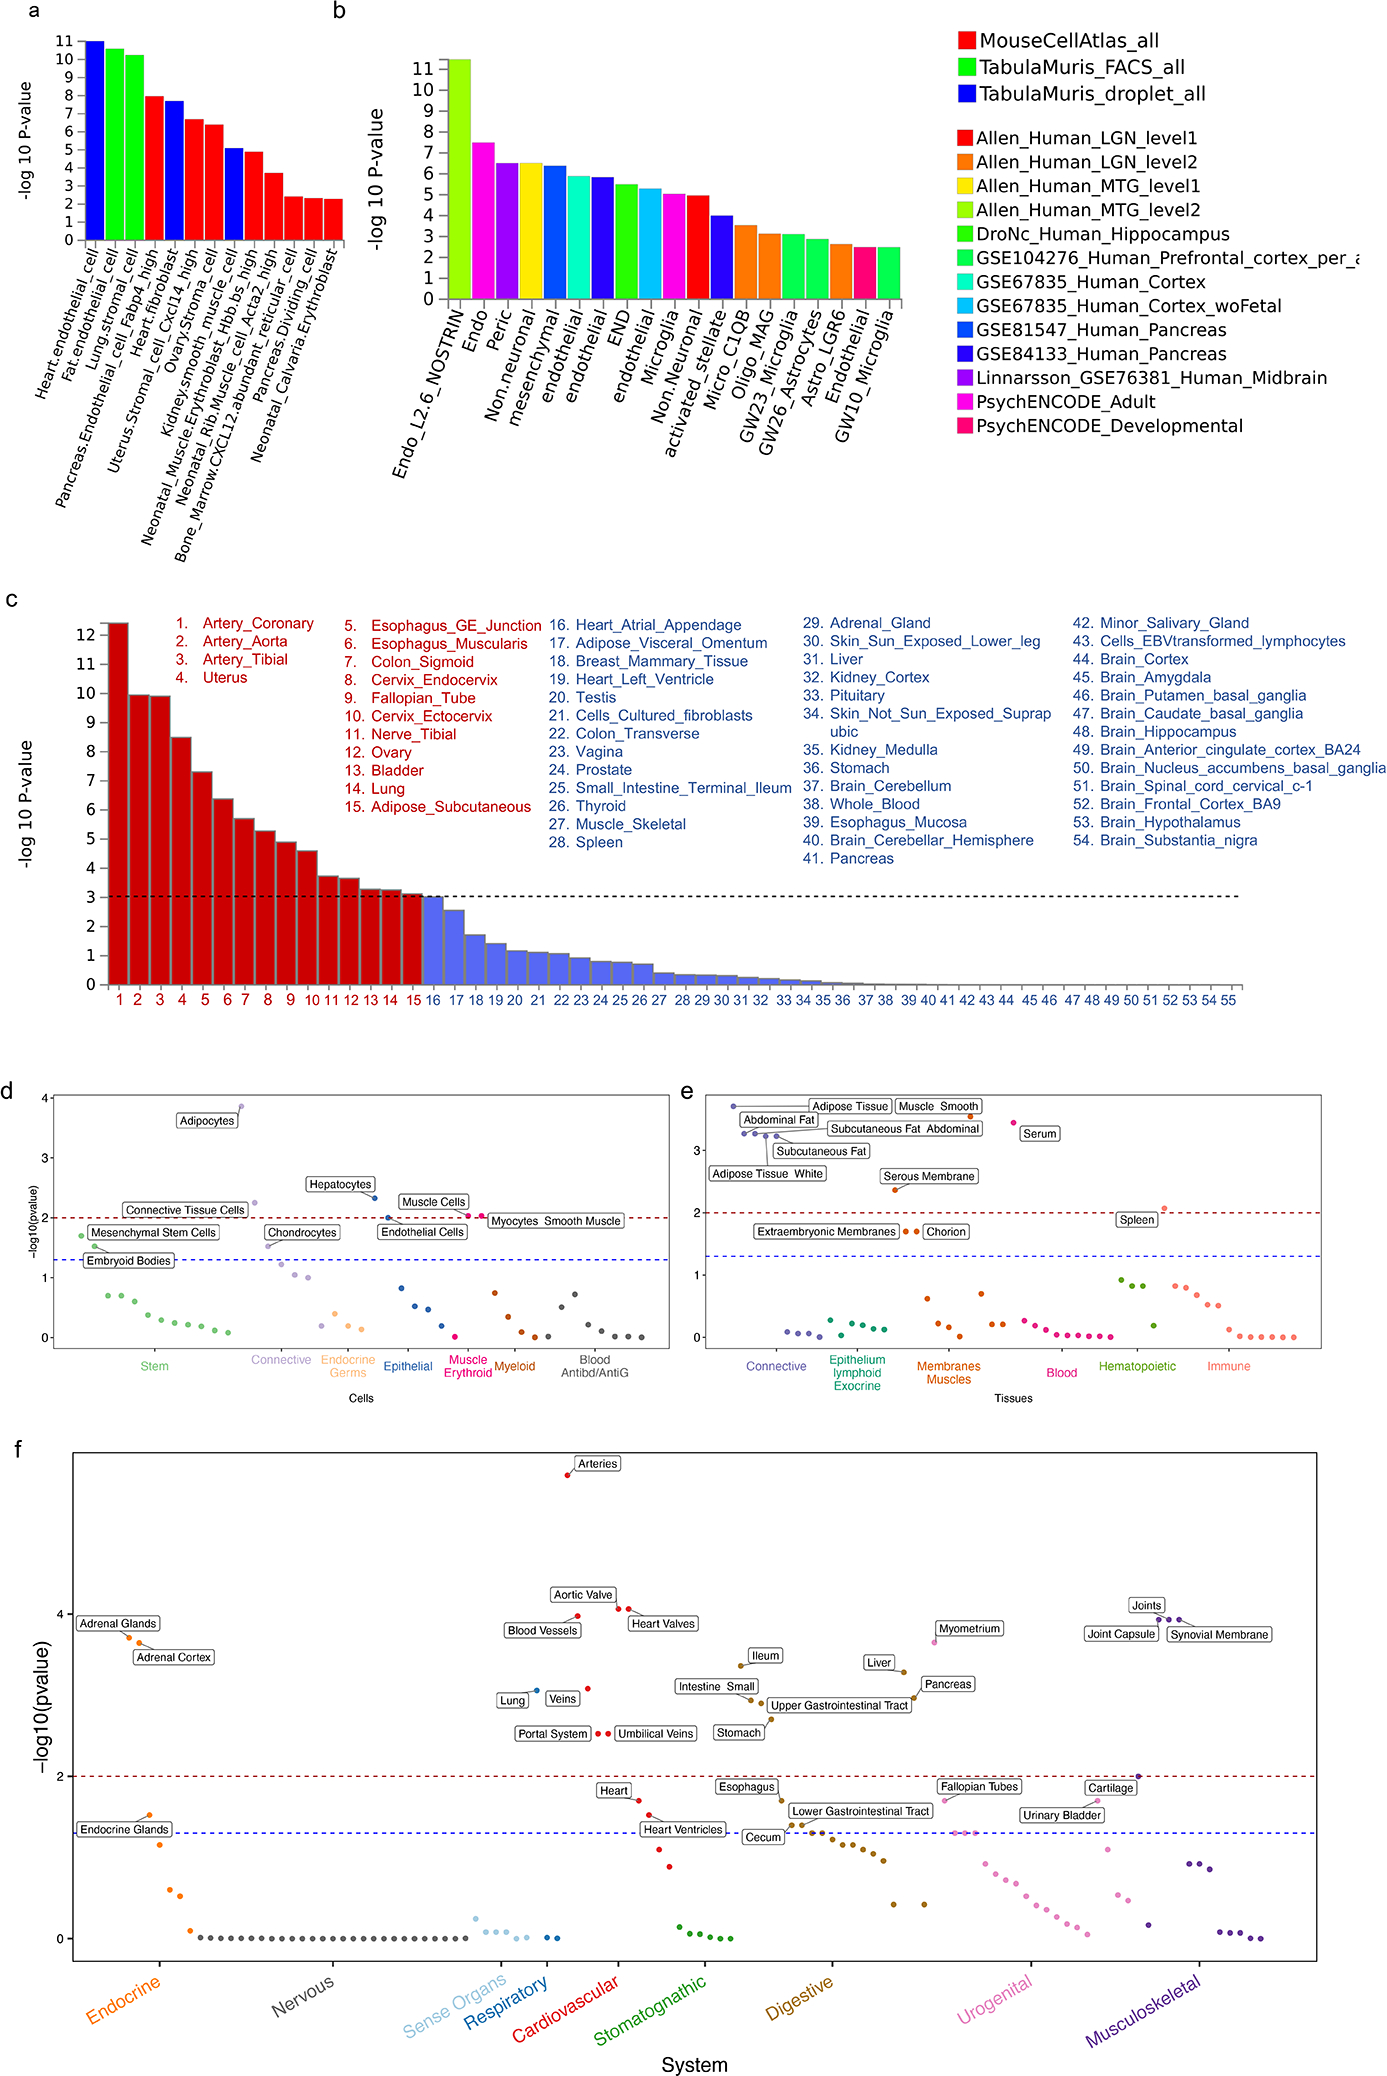
Fig. 5: Downstream analyses to prioritize systems, pathways, tissues, and cells relevant to CAD.

a-c, MAGMA gene-property analyses to test relationship between expressed genes in specific cells or tissues and genetic associations (meta-analysis of Whites) as implemented in FUMA. The gene-property analysis is based on the regression model, Z∼β0+EtβE+AβA+BβB+ϵ where Z is a gene-based Z-score converted from the gene-based P-value, B is a matrix of technical confounders, Et is the gene expression value of a testing tissue type c and A is the average expression across tissue types in a data set. A one-sided test (βE>0) is performed testing the positive relationship between tissue specificity and genetic association of genes. Data in a are restricted to three mouse single-cell RNA-seq (sc-RNA) datasets involving a broad range of cell types/organs while data in b are restricted to human datasets mostly involving the brain but also the pancreas and blood. Results show only independent cell-type associations based on within-dataset conditional analyses ordered by p-value across datasets. Data in c shows results for 54 specific tissue from the GTEx RNA-seq dataset v8 in order of p-value significance with red bars and font highlighting statistically significant tissues after adjusting for multiple testing (horizontal black dashed line) while remaining tissues are in blue. d-f, DEPICT following standard algorithm on the same GWAS used for MAGMA analyses in a-c. A tissue/cell type expression matrix was constructed by averaging gene expression levels of microarray samples with the same Medical Subject Heading tissue and cell type annotation. In this matrix, each column includes relative and normalized expression values of genes across 209 tissue/cell types. Enrichment in a tissue/cell type is then quantified by summing z-scores of the expression of genes with variants reaching genome wide significance in our meta-analysis of Whites. Z-scores are adjusted for confounding factors using 200 precomputed null GWAS in the Diabetes Genetics Initiative (DGI). Type 1 error rates were calculated by replacing null GWAS in DGI with simulated GWAS with positive signals but no underlying biological basis. DEPICT results are separated into d, cells e, tissues, and f, systems. −log10(p-value) for a false discovery rate (FDR) of <0.05 is demarcated by red dashed line while the FDR <0.2 threshold is shown in blue. Only cells/tissues reaching an FDR<0.2 are labelled.
