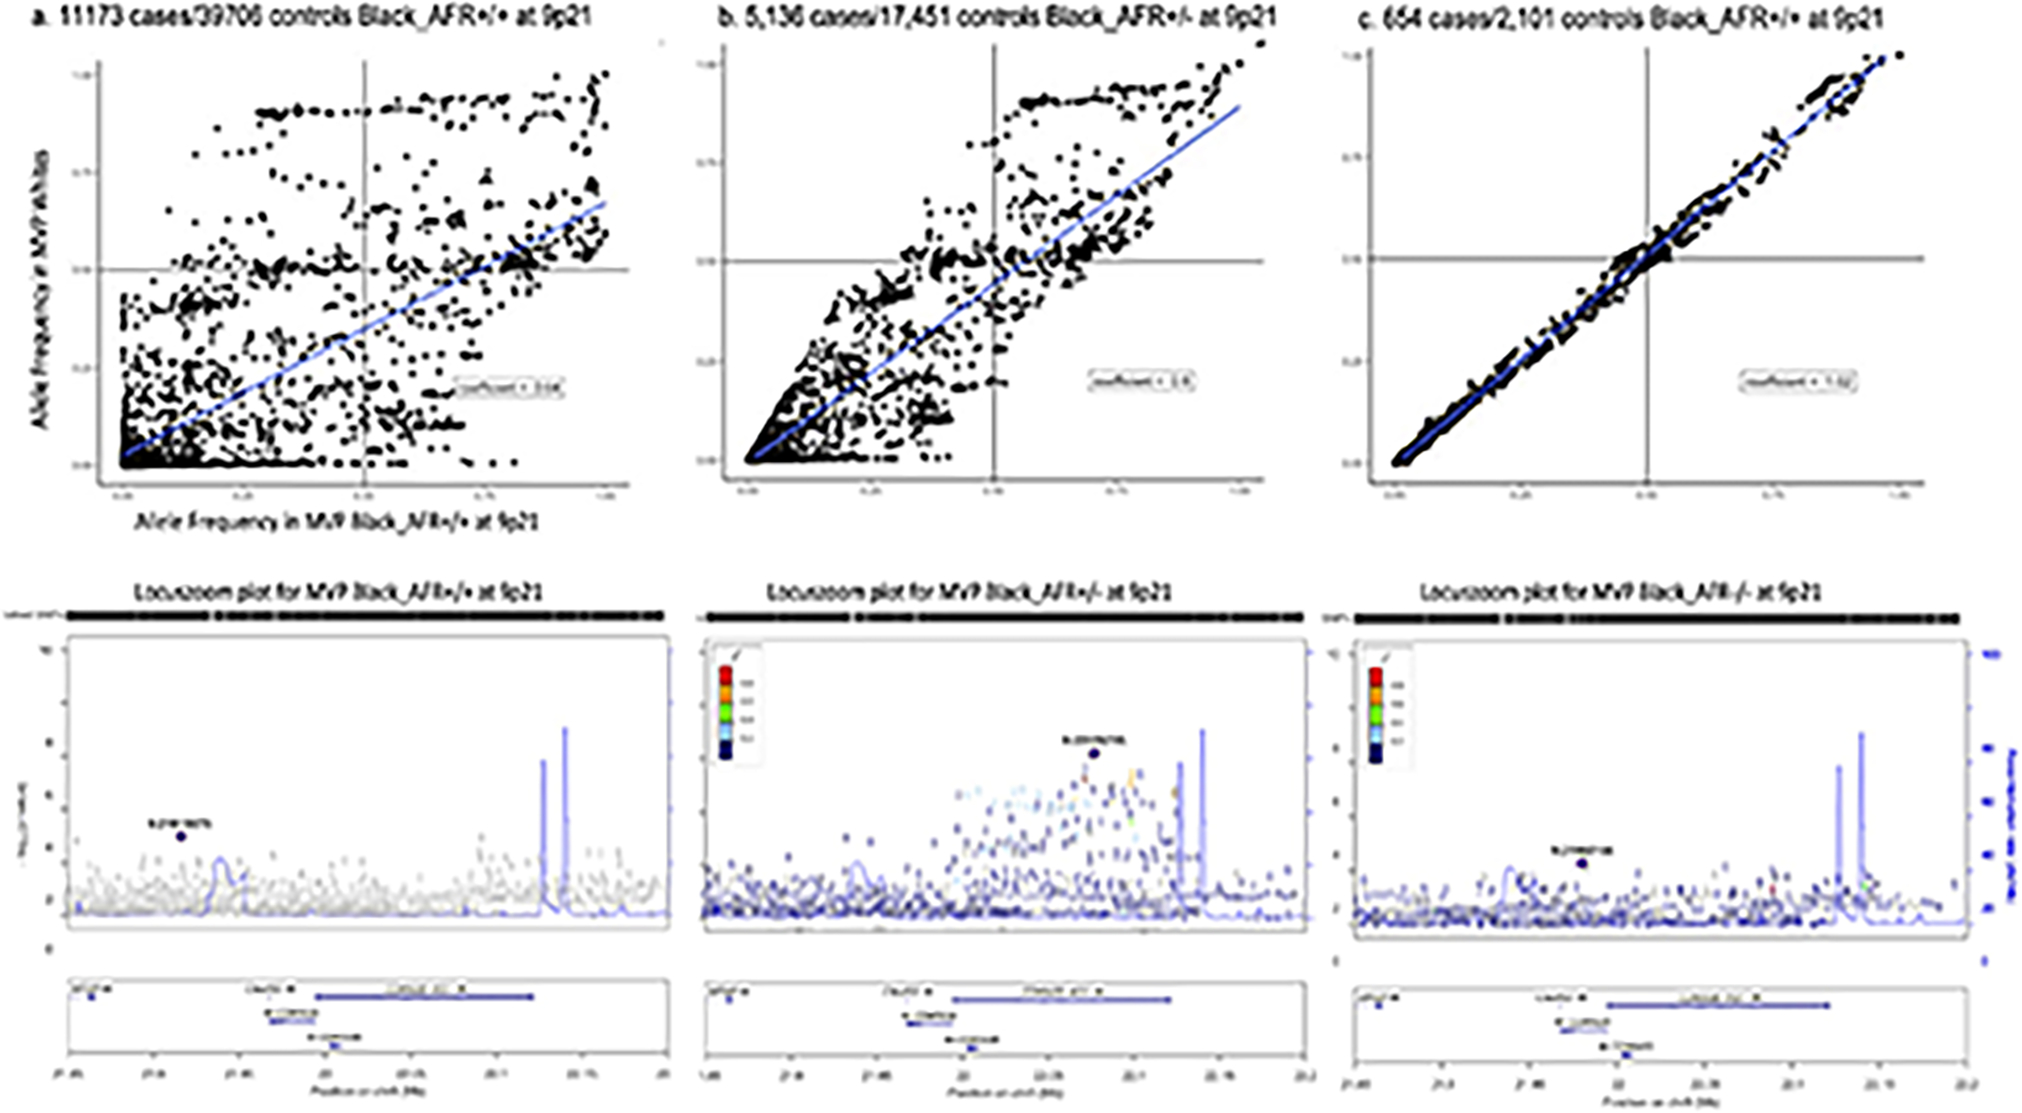
Extended Data Fig. 2. Allele frequencies and association results at the 9p21 locus among Black in the Million Veteran Program stratified by local ancestry status.

Top panels show plots of corresponding allelic frequencies at the 9p21 susceptibility locus observed in MVP Whites vs. subgroups of MVP Blacks including those with a. two African chromosomes (chr), b. one African chr, and c. no African chr at the locus. Corresponding LocusZoom plots for each group are in the panels immediately below. Association testing was performed using logistic regression with adjustment on sex and principal component as implemented in PLINK. P values were derived from a Wald test and are two-sided.
