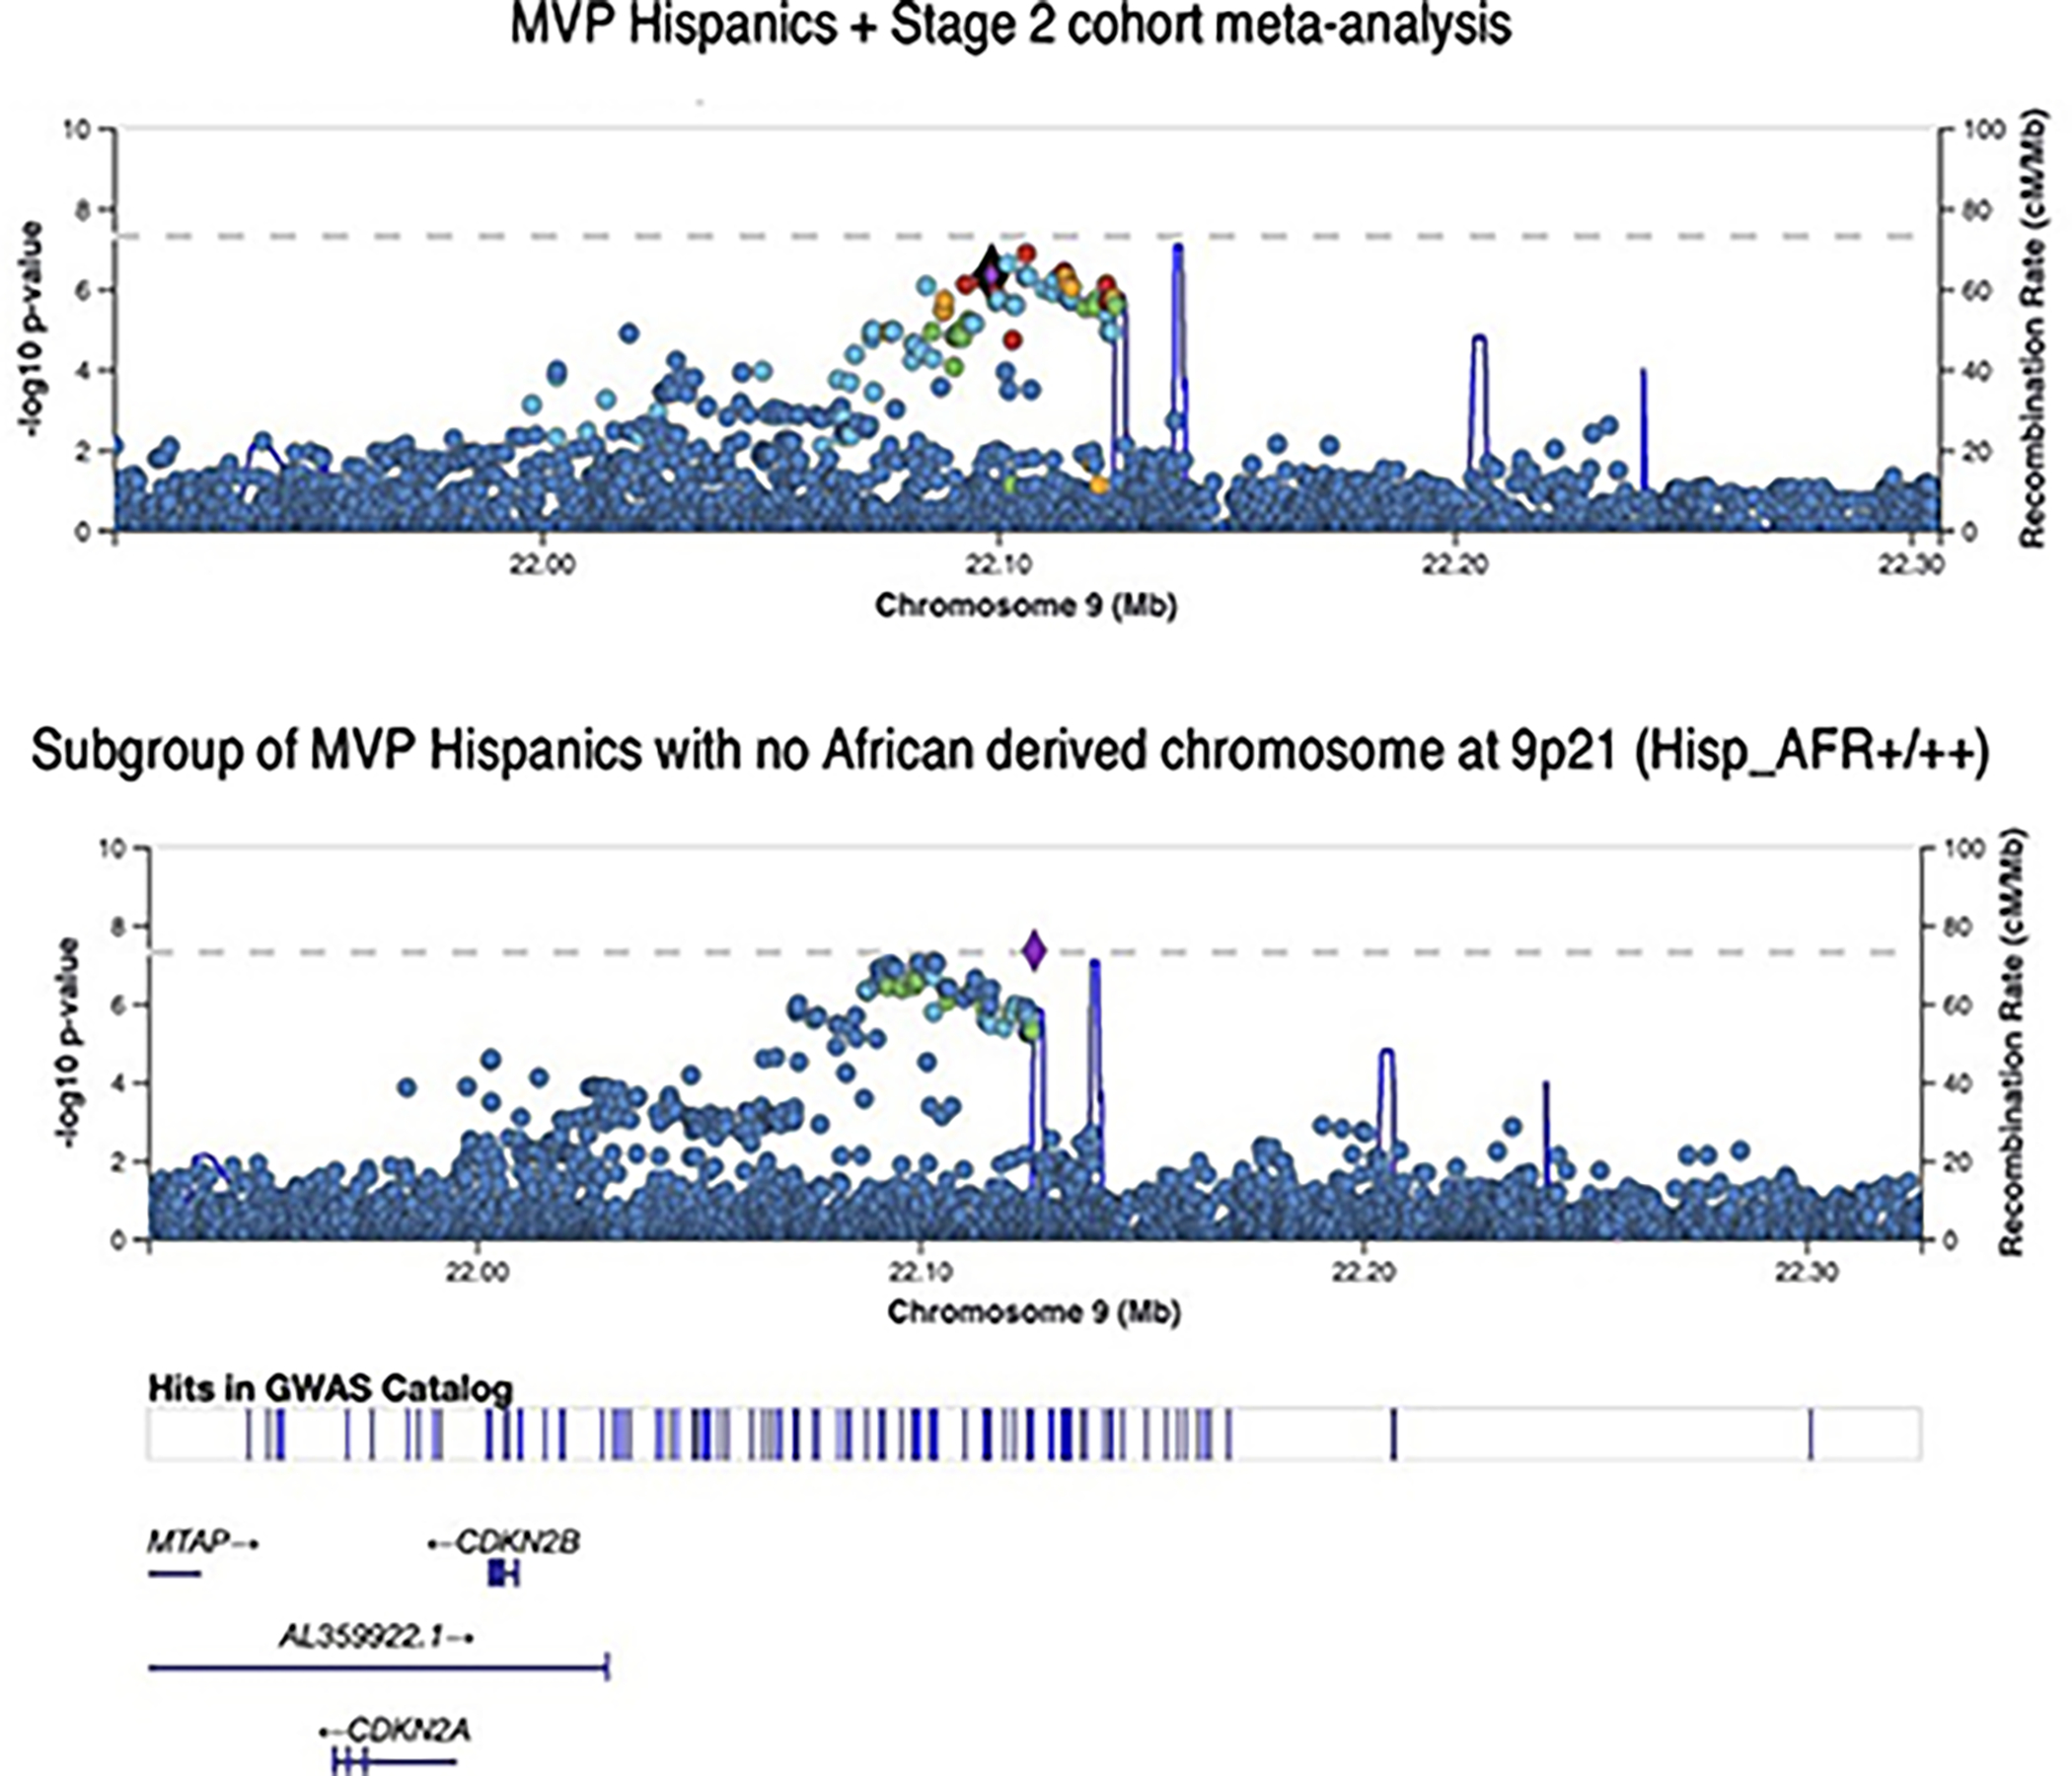
Extended Data Fig. 3. LocusZoom plots of SNP association at the 9p21 susceptibility locus for CAD.

Top panel plots the results for MVP GWAS of all Hispanics + Stage 2 cohort meta-analysis. P values are derived from inverse variance weighted meta-analysis using METAL and are two-sided. Bottom panel plots the subset of MVP Hispanics with no African derived chromosomes at 9p21 based on local ancestry assessment using RFMix (5,298 cases / 20,556 controls). Association testing was performed using logistic regression with adjustment on sex and principal component as implemented in PLINK. P values were derived from a Wald test and are two-sided.
