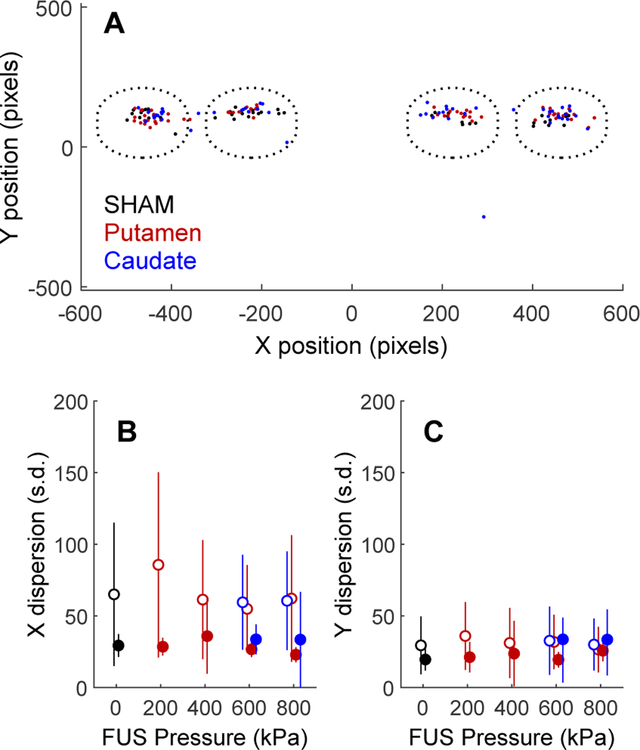
Figure 3. Effects of FUS on touch precision.
A, X and Y initial touch coordinates for three sessions (one each of sham, putamen sonication and caudate sonication) for NHP P. The dotted circles indicate the approximate size and locations of the motion stimuli. B, X-axis dispersion (standard deviation of initial touch coordinates) as a function of FUS pressure (0 = sham). Open symbols are NHP P, closed are NHP Q. Data point are slightly shifted horizontally for clarity. C, Y-axis dispersion of touch coordinates (same conventions as B).

