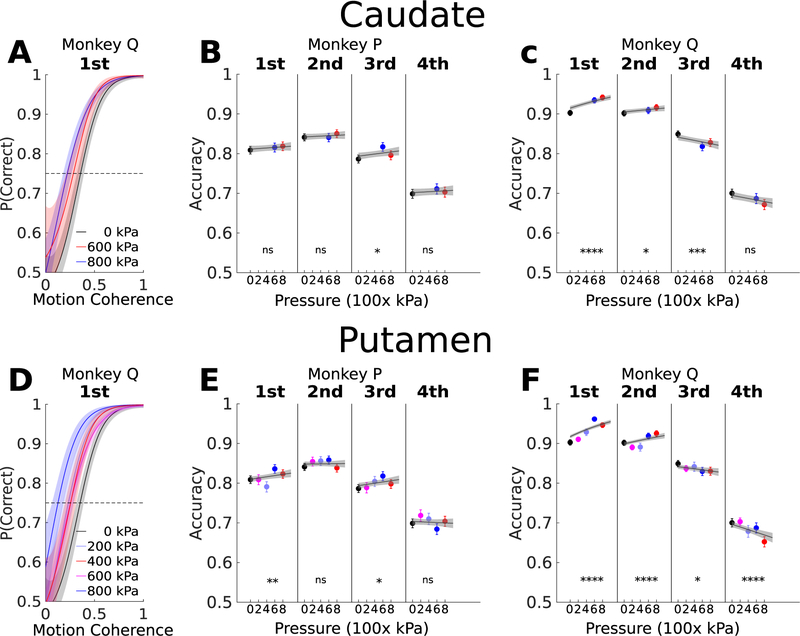
Figure 6. Performance (overall percent correct) divided into response time quartiles, as a function of sonicated region and pressure.
A,D, Psychometric functions using nonparametric estimation (gaussian process regression) applied to the performance accuracy in the first quartiles in the distribution of response time in the case of FUS stimulation in caudate and putamen at pressure ranging from 0 (sham) to 800 kPa in monkey Q. B,C, the accuracy estimation with 90% confidence intervals in accuracy estimation for each response time quartile for monkeys P and Q when FUS stimulation was applied to caudate, the line correspond to the linear relation with the pressure by applied GLM, the gray region is the 95% confidence interval of the regression estimation. E,F, the same procedure as in B,C, but applied to putamen stimulation.ns p>0.05, * p<0.05, ** p<0.01, *** p<0.001 and **** p<0.0001.

