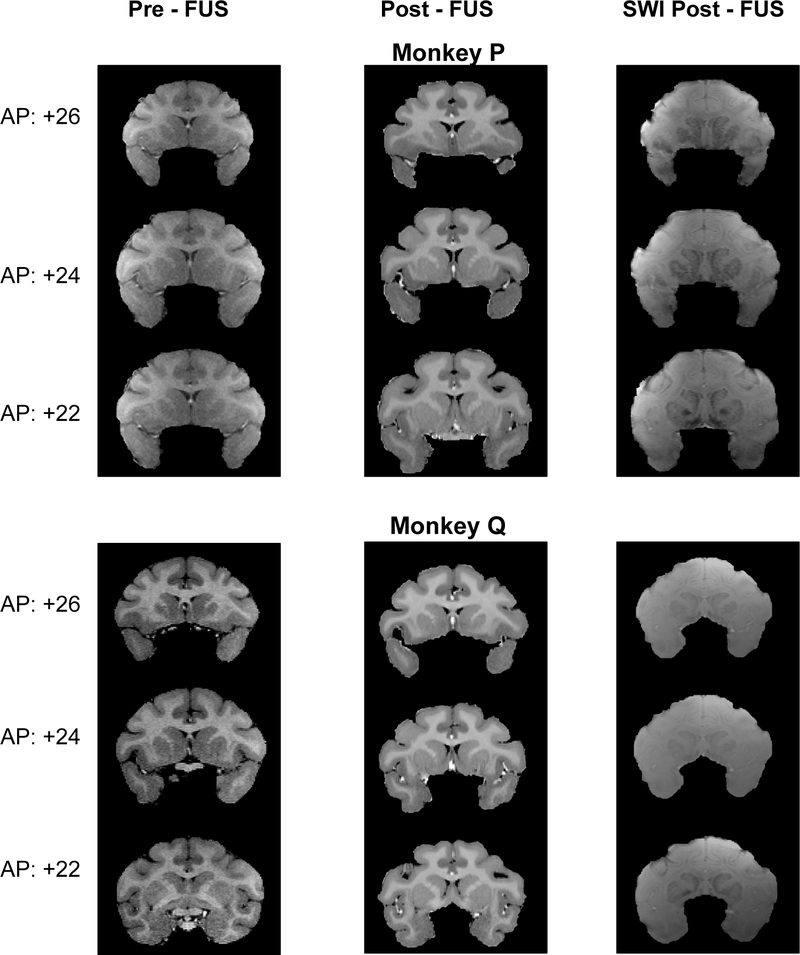
Figure 8. Structural MRIs at the start and end of the experiment for NHP P and Q.
A, Frequency spectrum of recordings from microphone place ipsilateral (red) or contralateral (blue) to transducer, or during sham textbfLeft, “Pre-FUS” T1-weighted MRI before the NHP had experienced any sonications. Middle “Post-FUS” T1-weighted MRI after all sonications had been completed. Right “Post-FUS” susceptibility-weighted MRI

