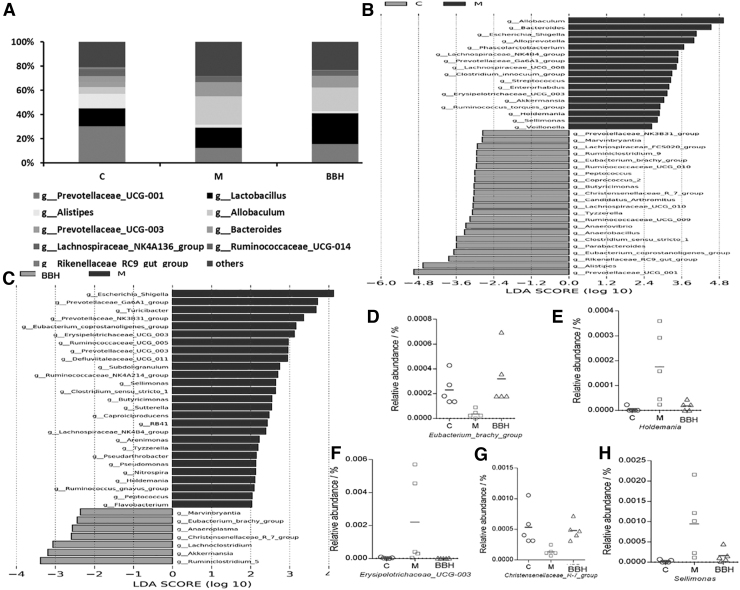
FIG. 6.
Relative genus abundance and difference in dominant microorganisms among groups in LefSe analysis. (A) Relative genus abundance in each group. (B) Dark gray color means upregulated genera and gray color means downregulated in each group compared with the control group. Control group and model group. (C) Model groups and BBH treatment groups. (D) Relative abundance of Eubacterium_brachy_group. (E) Relative abundance of Holdemania. (F) Relative abundance of Erysipelotrichaceae_UCG-003. (G) Relative abundance of Christensenellaceae_R-7_group. (H) Relative abundance of Sellimonas. n = 5 for each group. LDA, linear discriminant analysis; LefSe, LDA effect size.

