FIG. 6.
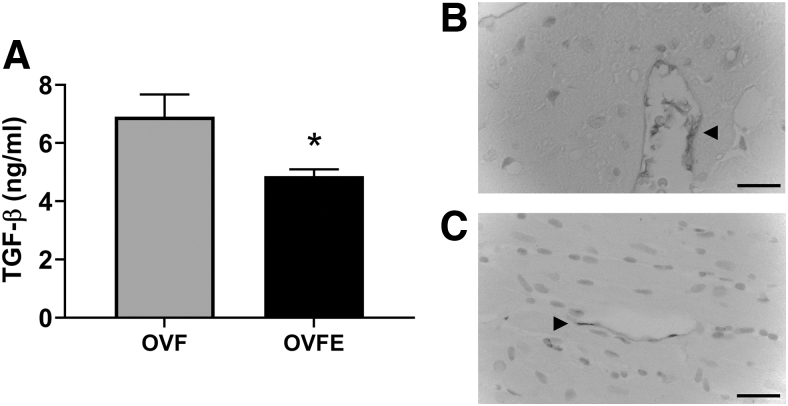
Effects of (−)-epicatechin treatment on plasma TGF-β1 levels (A). TGF-β1 immunostaining of representative sections of the LV (B). OVF (n = 10); (C) OVFE (n = 7). Arrowhead highlights areas of positive staining. Values are given as mean ± SEM, *P < .05 by t-test. TGF-β1, transforming growth factor-beta 1.

