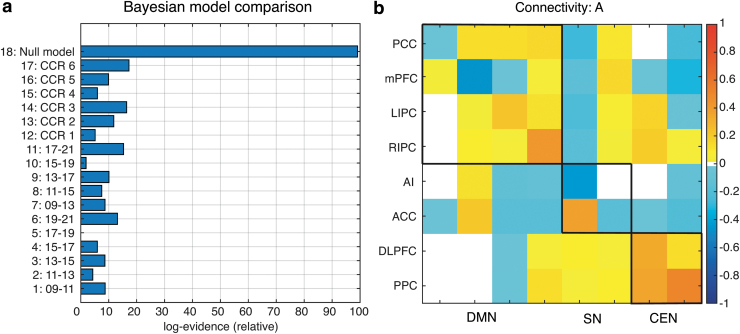
FIG. 1.
The figure summarizes effective connectivity results from the hierarchical Parametric Empirical Bayes analysis. (a) Bayesian Model Comparison on the connectivity parameter, where model 1–6 assumes deviating effect only for single timespans of 2 h, whereas model 7–11 assumes deviating effects for timespans of 4 h. The model 12–17 modeled different phase shifted version of an idealized circadian rhythm. Model 18 was the null model that assumed no time-of-day effects. (b) The estimation of effective connectivity (from columns to rows) across all subjects. The leading diagonal elements represent self-connections in logarithmic scale relative to the prior mean of −0.5 Hz. White space represents no significant effect at pp level >0.95.

