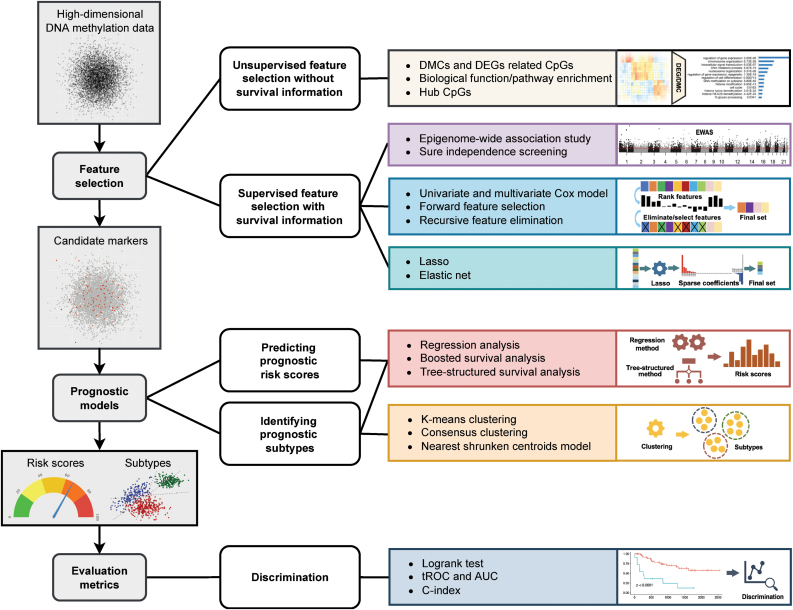
FIG. 1.
Overview of prognostic analysis of high-dimensional DNA methylation data. The left column provides the three-step procedure of prognostic analysis. First, feature selection methods identify a subset of informative markers that are associated with survival. Second, with the candidate markers, prognostic models either predict risk scores or stratify patients into subtypes. Finally, evaluation metrics are used to evaluate a model's discriminatory power. In each step, the computational methods are visualized and categorized in the right two columns. AUC, area under the ROC curve; C-index, concordance index; DEGs, differentially expressed genes; DMCs, differentially methylated CpG sites; EWAS, epigenome-wide association study; LASSO, least absolute shrinkage and selection operator; tROC, time-dependent receiver operating characteristic.

