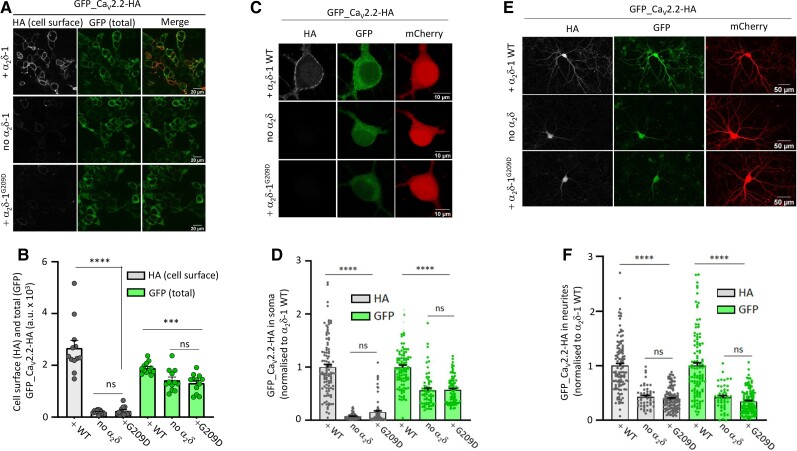
Figure 3.
α2δ-1G209D does not enhance CaV2.2 expression at the cell surface in tsA-201 cells and hippocampal neurons. (A) Representative confocal images of tsA-201 cells transfected with GFP_CaV2.2-HA with either α2δ-1 wild-type (WT) (without tag; top row), empty vector (no α2δ, middle row) or α2δ-1G209D (without tag; bottom row). HA staining was performed in non-permeabilized conditions (white, left), GFP signal shows total CaV2.2 (middle). The right panels represent the merged images (HA is shown in red). Scale bar = 20 μm. (B) Bar charts (mean ± SEM with individual data-points representing the mean of at least 50 cells from 12 coverslips) show CaV2.2 expressed at the cell surface (HA signal, grey bars) or total CaV2.2 (GFP, green bars) in the presence of α2δ-1 WT, empty vector (no α2δ-1) or α2δ-1G209D. Data obtained from four independent experiments; ns, P > 0.05; ***P = 0.0007, ****P < 0.0001, one-way ANOVA and Bonferroni post hoc test. (C) Representative confocal images of hippocampal somata imaged at ×63 objective and transfected with GFP_CaV2.2-HA and either α2δ-1 WT (top row), empty vector (no α2δ, middle row) or α2δ-1G209D (bottom row) together with β1b and mCherry. HA staining was performed in non-permeabilized conditions (grey, left), GFP signal (middle) and mCherry (transfection marker, right). Scale bar = 10 μm. (D) Bar charts (mean ± SEM with individual data-points) of HA (grey bars) and GFP (green bars) for α2δ-1 WT (n = 102), no α2δ (n = 63) and α2δ-1G209D (n = 82). Data obtained from three independent experiments; the values are normalized to α2δ-1 WT condition in each experiment. ns, P > 0.05; ****P < 0.0001, one-way ANOVA and Bonferroni post hoc test. (E) Representative confocal images of hippocampal neurons imaged at ×20 objective and transfected with GFP_CaV2.2-HA and either α2δ-1 WT (top row), empty vector (no α2δ, middle row) or α2δ-1G209D (bottom row) together with β1b and mCherry. HA staining was performed in non-permeabilized conditions (grey, left panels), GFP signal (middle) and mCherry (transfection marker, right). Scale bar = 50 μm. (F) Bar charts (mean ± SEM with individual data-points) of HA (grey bars) and GFP (green bars) for α2δ-1 WT (n = 114), no α2δ (n = 50) and α2δ-1G209D (n = 117). Data obtained from three independent experiments; the values are normalized to α2δ-1 WT condition in each experiment. ns, P > 0.05; ****P < 0.0001, one-way ANOVA and Bonferroni post hoc test. Note that for B, D and F, total CaV2.2 (GFP) was reduced in both the α2δ-1G209D and no α2δ conditions compared to α2δ-1 WT condition probably because of its increased degradation when CaV2.2 is poorly trafficked out of the endoplasmic reticulum.

