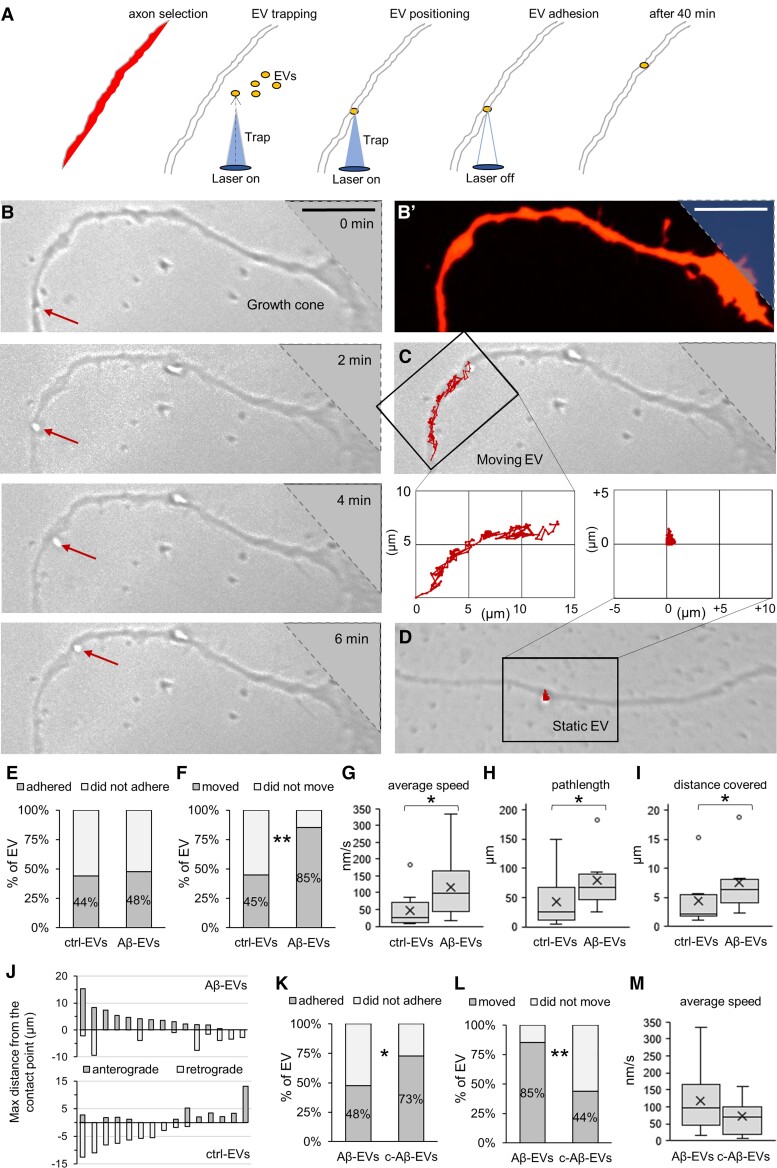
Figure 3.
Large Aβ-EV motion at the axon surface. (A) Schematic representation of large EV delivery to axons using optical tweezers. Axons were selected based on their morphology after RFP transfection. A single EV was trapped by the laser tweezers in bright field and placed in contact with the axon. The trapping laser was switched off 30 s after contact and EV–axon interaction was monitored in bright field time-lapse for 40 min. (B) Sequence of phase contrast images of a large EV moving anterogradely along the axon towards the growth cone. (B′) Corresponding fluorescence image of the axon in B. The top right blurred area indicates the region of the growth cone outside phase contrast images. (C) Trajectory of the EV in B superimposed to the phase contrast image. (D) Trajectory of a static EV superimposed to the phase contrast image. (E) Percentage of large ctrl-EVs and Aβ-EVs that adhered to axons (chi-square test, P = 0.768, n = 68 ctrl-EVs, n = 105 Aβ-EVs, 33 experiments). (F) Percentage of large ctrl-EVs and Aβ-EVs that displayed motility on axons (chi-square, P = 0.002, n = 29 ctrl-EVs, n = 34 Aβ-EVs, 31 experiments). (G) Average speed of large Aβ-EVs and ctrl-EVs (Mann–Whitney test, P = 0.011, n = 8 ctrl-EVs, n = 18 Aβ-EVs, 19 experiments). (H and I) Pathlength (H) and maximum distance from the contact point in both directions (I) reached by large ctrl-EVs and Aβ-EVs in 10 min (Mann–Whitney, P = 0.033, for both; n = 8 ctrl-EVs, n = 13 Aβ-EVs, 19 experiments). (J) Anterograde and retrograde motion of large Aβ-EVs and ctrl-EVs (n = 15). (K) Percentage of large Aβ-EVs and Aβ-EVs pre-coated with annexin-V (coated Aβ-EVs, c-Aβ-EVs) that adhered to axons (chi-square, P = 0.014, n = 105 Aβ-EVs, n = 37 c-Aβ-EVs, 24 experiments). (L) Percentage of large Aβ-EVs and c-Aβ-EVs that displayed motility (chi-square, P = 0.002; n = 34 Aβ-EVs, n = 25 c-Aβ-EVs, 23 experiments). (M) Average speed of large Aβ-EVs and c-Aβ-EVs (t-test, P = 0.142, n = 18 Aβ-EVs, n = 11 c-Aβ-EVs, 16 experiments). Scale bars: 10 µm. Percentage values are raw percentages over total EV tested. Box plots show the median (central line) and mean (X), upper and lower quartile (box limits), maximum and minimum values (whiskers).

