Figure 5.
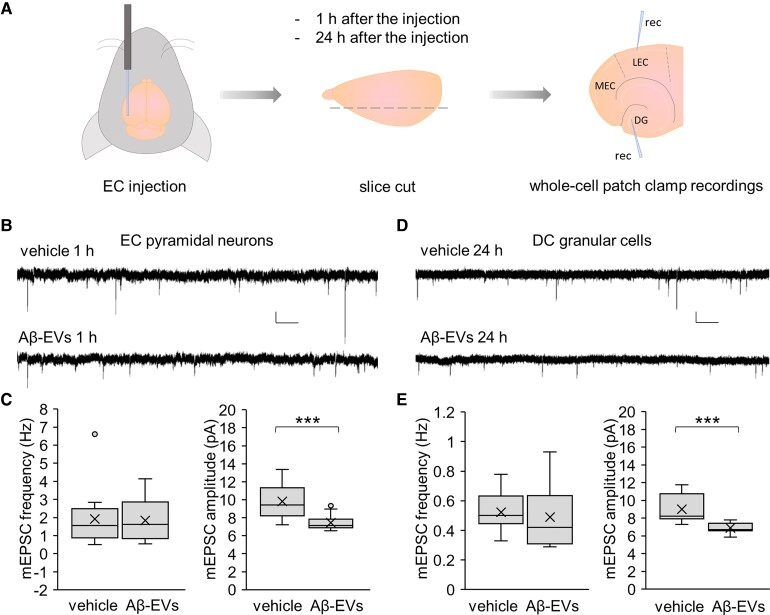
Aβ-EVs decrease mEPSC amplitude without affecting their frequency. (A) Experimental protocol for whole-cell patch-clamp recordings in EC–DG slices after Aβ-EV (0.25 × 10⁸ EVs/μl, 1 μl) or vehicle injection. Recording electrodes are shown. (B and C) Representative traces of mEPSCs recorded from pyramidal cells of EC superficial layer II 1 h after injection of Aβ-EVs or vehicle in the EC (B) and corresponding plots of mEPSC frequency and amplitude (C; mEPSC frequency, t-test, P = 0.900; mEPSC amplitude, Mann–Whitney rank sum test, P ≤ 0.001; vehicle, n = 13 cells; Aβ-EVs, n = 13 cells; 7 mice each). (D and E) Representative traces of mEPSCs recorded from granular cells of the DG 24 h after injection of Aβ-EVs or vehicle in the EC (D). The plots show corresponding mEPSC frequency and amplitude (E; mEPSC frequency, t-test, P = 0.655; mEPSC amplitude, t-test, P ≤ 0.001; vehicle, n = 12 cells; Aβ-EVs, n = 13 cells; 6 mice each). Vertical scale bar: 5 pA; Horizontal scale bar: 1 s. Box plots show the median (central line) and mean (X) values, upper and lower quartile (box limits), maximum and minimum values (whiskers).

