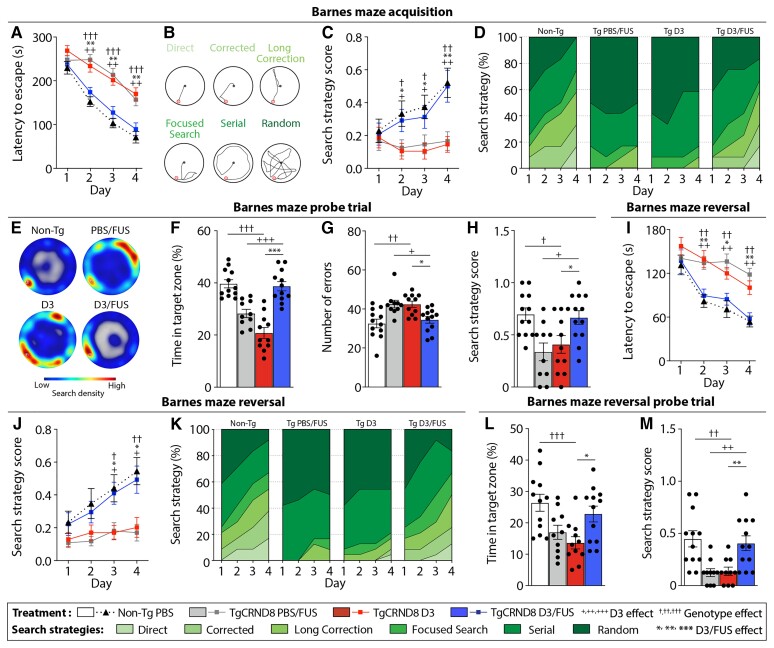
Figure 2.
MRIgFUS-mediated delivery of D3 promotes spatial memory and cognitive flexibility in TgCRND8 mice. In the Barnes maze, D3/FUS enhanced spatial navigation in TgCRND8 mice relative to PBS/FUS and D3-treated TgCRND8 controls. (A) TgCRND8 mice demonstrated a slower learning curve relative to non-Tg mice, unless treated with D3/FUS. (B) Search strategies used by mice in the Barnes maze were classified. (C and D) Similar to non-Tg controls, D3/FUS-treated TgCRND8 mice used spatially-dependent search strategies to locate the escape box. (E–H) Performance in the probe test was improved by D3/FUS treatment, reflecting memory retention. This was demonstrated by (E) higher search density at the previous location of the escape box, (F) more time spent near the target hole in the absence of the escape box, (G) fewer entries in non-target holes (errors) and (H) higher search strategy scores of D3/FUS-treated TgCRND8 mice relative to PBS/FUS and D3-treated controls. (I–K) Barnes maze reversal learning, with the target hole relocated 180° from the original position, was improved by D3/FUS treatment in TgCRDN8 mice. (I) Relative to PBS/FUS and D3-treated TgCRND8 mice, non-Tg mice and D3/FUS-treated TgCRND8 mice demonstrated faster escape latency, (J) better spatially-dependent navigation as demonstrated by higher search strategy scores and (K) percentage of spatial strategies used across trial days. (L and M) Performance in the reversal probe test was improved in TgCRND8 mice following D3/FUS treatment, with (L) more time spent in the target zone and (M) higher search strategy score relative to D3-treated TgCRND8 mice. Statistics: (A, C, I and J) Repeated measures and (F–H, L and M) one-way ANOVA with Holm-Sidak post hoc test. Significance: *,+,†P < 0.05; **,++,††P < 0.01, ***,+++,†††P < 0.001. †Comparison of D3-treated TgCRND8 mice with PBS-treated non-Tg mice (genotype effect). +Comparison of PBS/FUS-treated with D3/FUS-treated TgCRND8 mice (D3 effect). *Comparison of D3-treated with D3/FUS-treated TgCRND8 mice (D3/FUS effect). Data represent means ± SEM; n = 10–12 per group.

