FIG. 6.
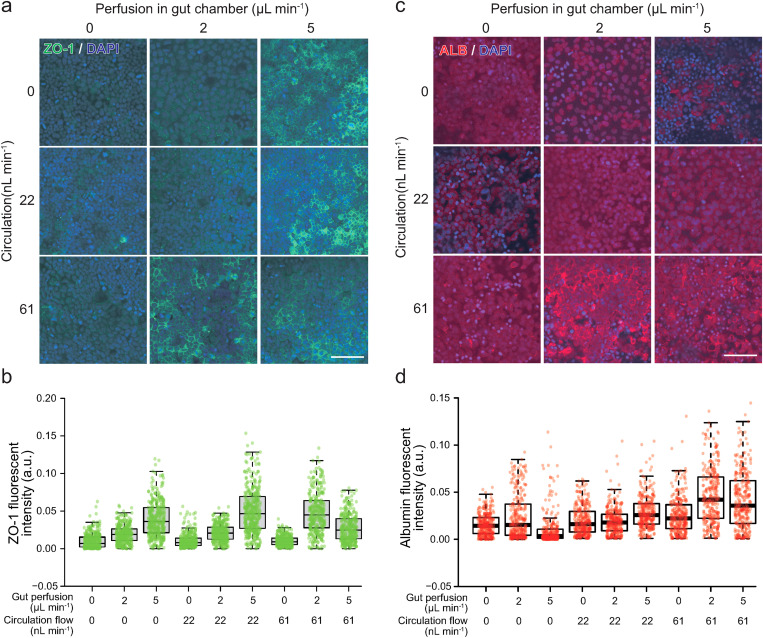
Optimal perfusion and circulation flows enhanced the expression of ZO-1 in Caco-2 cells and ALB in HepG2 cells. (a) Immunofluorescent micrographs of the ZO-1 (green) expression in Caco-2 cells. (b) Quantitative single-cell profiling of the ZO-1 expression in Caco-2 cells. P values estimated by the Tukey's multiple comparison test are shown in Table S1 in the supplementary material. (c) Immunofluorescent micrographs of the ALB (red) expression in Caco-2 cells. (d) Quantitative single-cell profiling of the ALB expression in HepG2 cells. Centerlines of box plots indicate medians; box limits indicate the 25th and 75th percentiles as determined by R software; whiskers extend 1.5 times the interquartile range from the 25th and 75th percentiles. P values estimated by the Tukey's multiple comparison test are shown in Table S2 in the supplementary material. Nuclei were stained with DAPI. The scale bar represents 100 μm.

