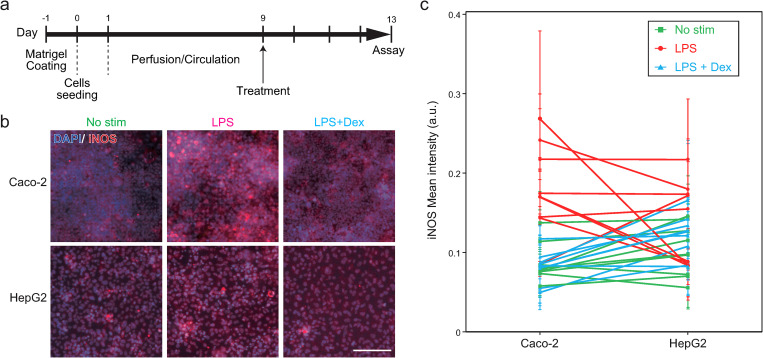
FIG. 8.
In vitro recapitulation of IBD in the GLA-MPS. (a) Experimental procedure of cell culture and treatment. (b) Immunofluorescent micrographs of the iNOS (red) expression in Caco-2 and HepG2 cells with no stimulation (no stim), 1 mg ml−1 lPS treatment (LPS), and 1 mg ml−1 lPS with 200 μM Dex treatment (LPS + Dex). Nuclei were stained with DAPI. The scale bar represents 100 μm. (c) Quantification of the iNOS expression in individual Caco-2 and HepG2 cells based on the immunofluorescent micrographs shown in (b). Each bar and error bars represent the mean ± standard deviations. n = 3. P values of the Tukey's multiple comparison test are summarized in Table S3 in the supplementary material.

