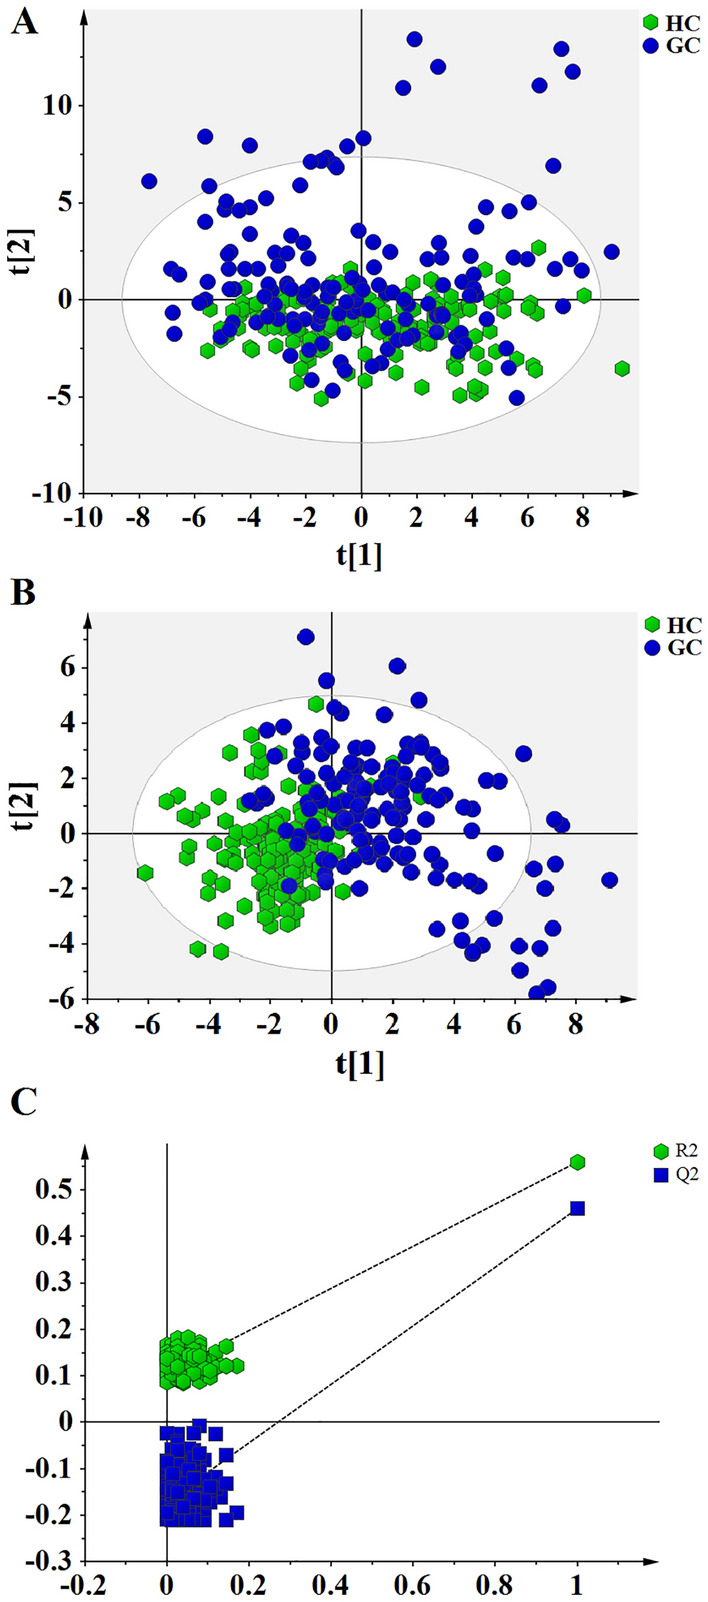
Figure 2.

Score plots of PCA and PLS-DA analyses based on 93 metabolites for patients with GC and healthy individuals in the training set. (A) Score plot of PCA analysis, suggesting separating trend between GC and HC groups. The colors and shapes display the participants from different groups (healthy individuals and patients with gastric cancer). (B) Score plot of PLS-DA analysis, showing differential metabolic profiles in patients with GC compared to healthy individuals. (C) 200-times permutation test for evaluating the performance of PLS-DA model. The y-axis intercepts in test plot were R2 = (0.0, 0.109), Q2 = (0.0, -0.176).
