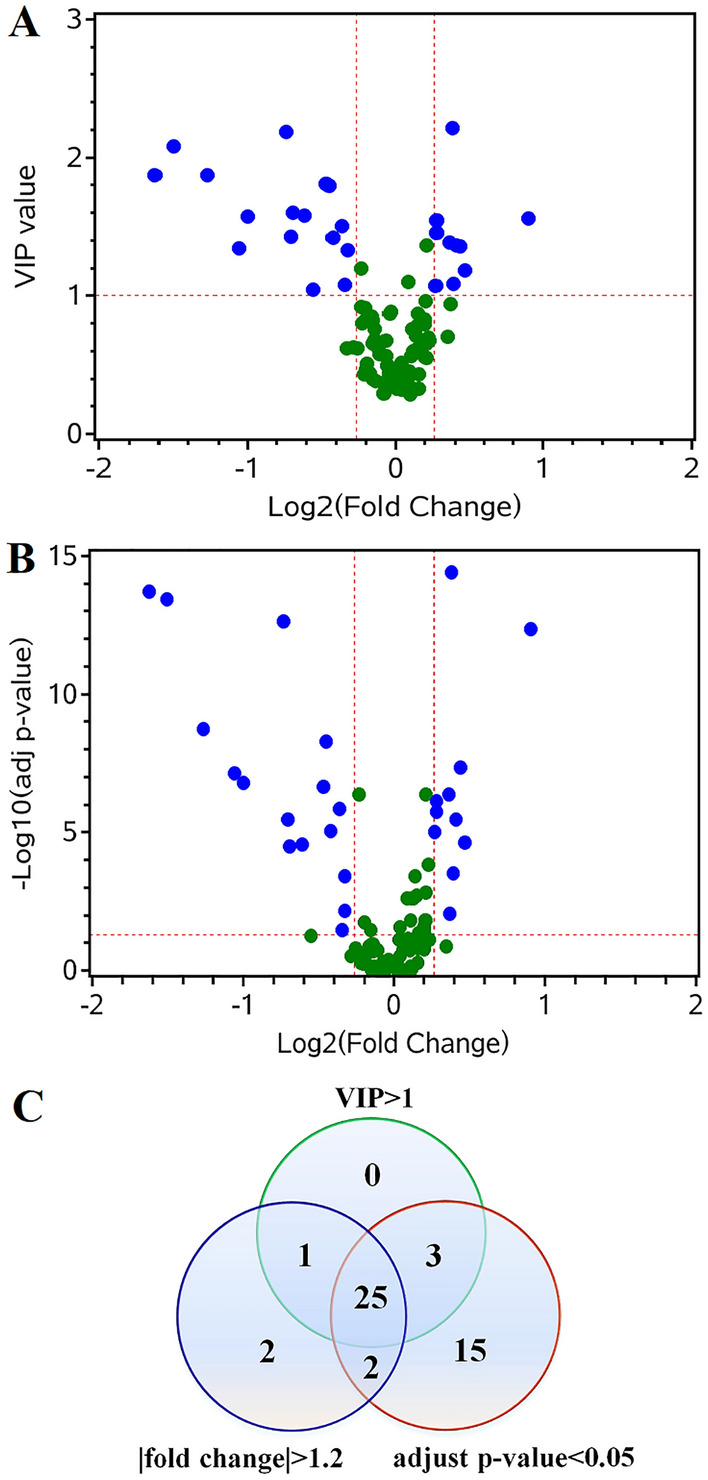
Figure 3.

Identification of potential biomarkers for distinguishing patients with GC from healthy individuals in training set. (A) The plot of VIP value versus fold change (FC). The differential metabolites were defined with VIP > 1 and FC > 1.2 or < -1.2 between patients with GC and healthy individuals. The selected metabolites were colored in blue. (B) The plot of adjusted p-value versus FC. The changed metabolites were displayed with adjusted p-value < 0.05 and FC > 1.2 or < -1.2 in patients with GC compared to healthy individuals. (C) Venn diagram demonstrates differential metabolites in GC group compared with healthy group. Twenty-five differential metabolites were selected with VIP > 1 and adjusted p-value < 0.05 and FC > 1.2 or < − 1.2.
