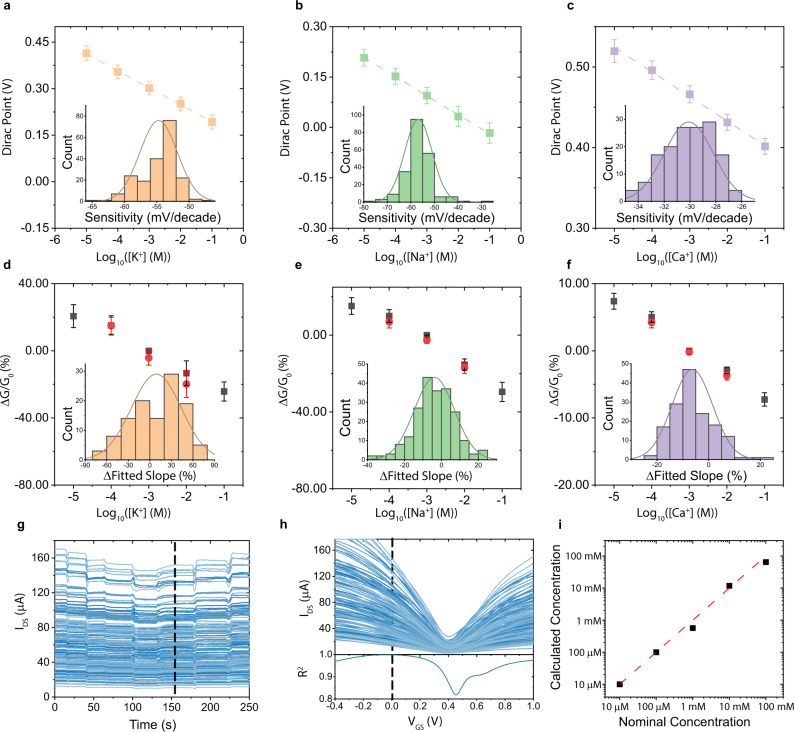
Fig. 2. ISMs-functionalized graphene sensing chip and profile matching calibration.
The minimum conduction point as a function of ion concentration for a K+ ISM, b Na+ ISM, and c Ca2+ ISM functionalized graphene sensor chips. Error bars indicate the standard deviation of the Dirac Points of all the working devices on the chip. Dashed lines are the linear fits of the Dirac Points and the slopes of the fitted lines are the sensitivity. Insets depict the sensitivity distribution of individual devices on each chip. d–f The average change in channel conductance for K+ ISM, Na+ ISM, and Ca2+ ISM functionalized sensing chip showing excellent reversibility over several magnitude change in K+, Na+, and Ca2+ concentration. Black dots are measurements going from low ion concentration to high, while red dots are measurements going from high ion concentration to low. The percentage change in conductance is normalized with respect to the data taken at 1 mM and the error bars are given by the standard deviation. Histograms in the insets show the reversibility distribution of individual devices on the sensor array. g Current transient response of all devices with VGS = 0 V. The black dotted line indicates the source-drain current distribution at Ca2+ concentration of 10 mM. h I–V characterization of all devices at Ca2+ concentration of 10 mM and the correlation coefficients (R2) obtained by matching the transient slices of 10 mM Ca2+ to I–V characterizations at different VGS slices. i Calculated concentration at discrete intervals (black squares) using the profile-matching calibration method are plotted as x-values against the true concentration as the y-values. A fitted line (red dashed line) with a slope of 0.969 with an R-squared value of 0.996, indicating the effectiveness of the calibration method.

