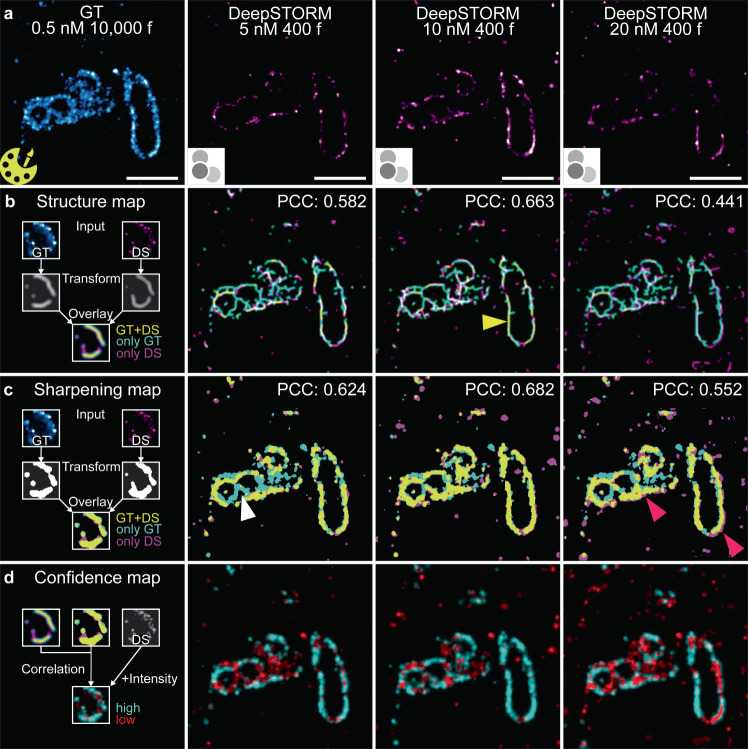
Fig. 3. Quantitative analysis of image similarity between ground truth (GT; yellow Picasso icon) and predicted super-resolution images (DeepSTORM icon) using HAWKMAN.
a GT (cyan) and DeepSTORM (DS) predicted images (magenta) of a TOM20-labelled structure recorded for imager strand concentrations of 0.5, 5, 10, and 20 nM. b Structure map with Pearson correlation coefficients (PCC) indicating either regions of good overlap between GT and predicted image (yellow structures; yellow arrow), denser GT structures (cyan structures; white arrow) or denser DeepSTORM predicted structures (magenta structures; magenta arrow). c Sharpening map indicating regions of artificial sharpening with the same colour scheme as the structure map. d Confidence map highlighting structures of high confidence (cyan) and low confidence (red). b, c, d; first column) Schematic explaining HAWKMAN maps. HAWKMAN applied to n = 1 ROI (a–d); scale bars: 1 µm.

