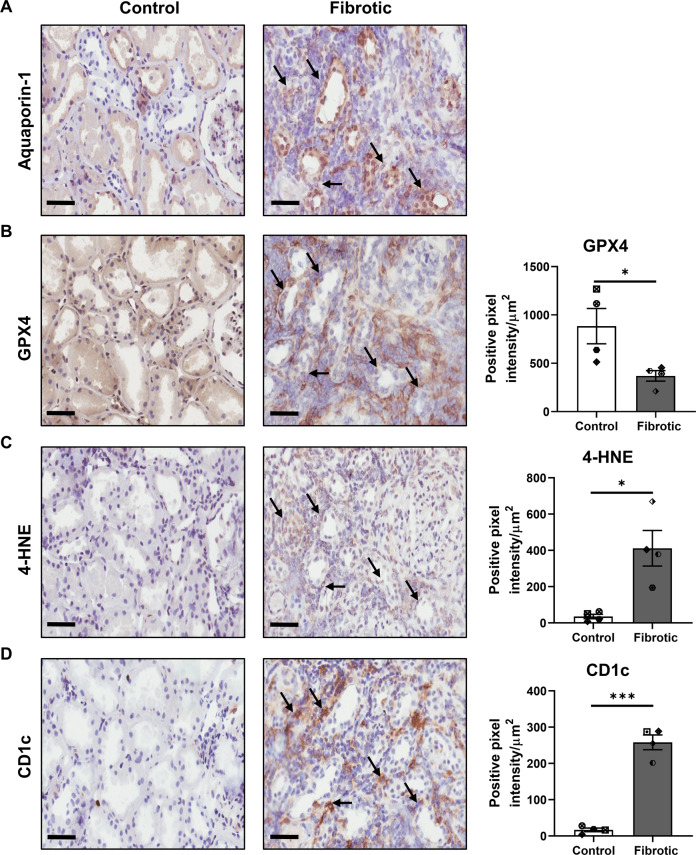
Fig. 3. Co-localisation of human CD1c+ DC with ferroptotic PTEC in fibrotic kidney tissue.
Representative serial section immunohistochemical (IHC) staining of control/non-fibrotic (left panel) and fibrotic (middle panel) kidney tissue probed for (A) aquaporin-1, (B) GPX4, (C) 4-HNE and (D) CD1c. Regions of CD1c+ DC co-localisation with aqupaporin-1+ PTEC displaying evidence of ferroptotic cell death (↓ GPX4 and ↑ 4-HNE) are highlighted with black arrows. Scale bars represent 60 µm. Quantitative analysis (positive pixel intensity/µm2 total area) of IHC staining in control and fibrotic tissue is presented (right panels). Symbols represent values for individual donor tissue. Results represent mean ± SEM of values from four randomly selected areas for each tissue sample. *P < 0.05, ***P < 0.001, Welch’s t test.

