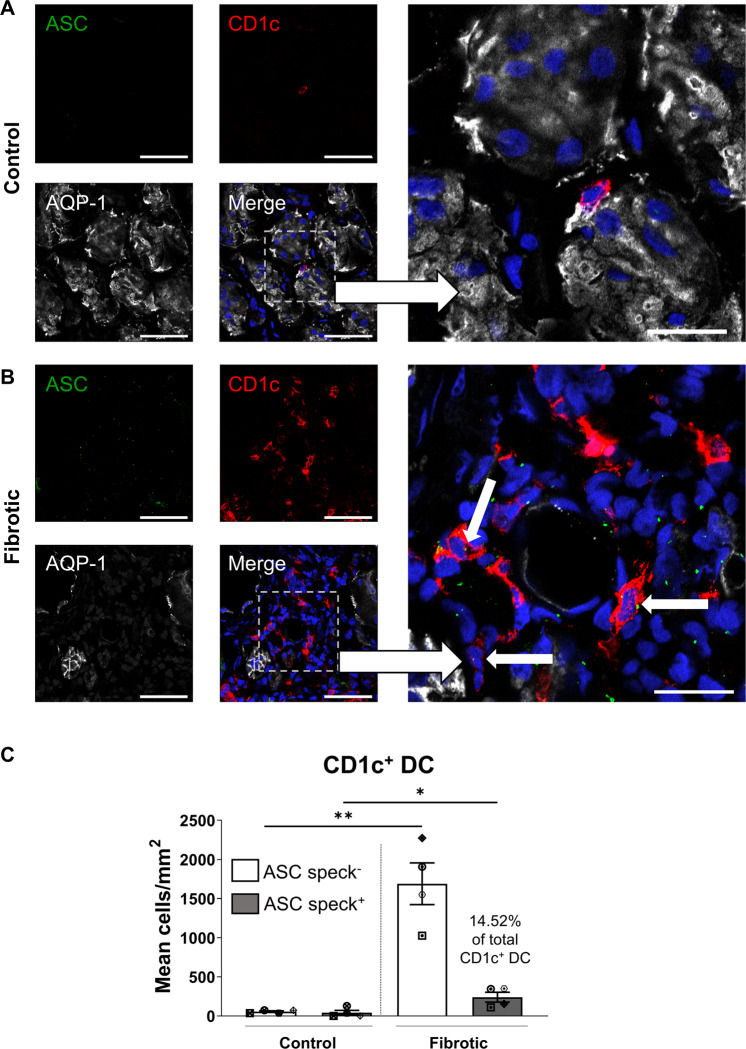
Fig. 6. Significantly elevated tubulointerstitial CD1c+ DC with ASC specks in fibrotic kidney tissue.
A, B Immunofluorescent labelling of frozen sections from control/non-fibrotic (A) and fibrotic kidney tissue (B) stained for ASC (green), CD1c (red), aquaporin-1 (AQP-1) (white) and DAPI (blue). Scale bars represent 50 µm for small frames (left panels) and 20 µm for large frames (right panels). ASC-speck-positive CD1c+ DC are highlighted with white arrows. C Quantification (mean cells/mm2) of ASC-speck-negative CD1c+ DC (white bars) and ASC-speck-positive CD1c+ DC (grey bars) in control/non-fibrotic kidney tissue (n = 4) and fibrotic kidney tissue (n = 4). Symbols represent values for individual donor tissue. Results represent mean ± SEM of values from five randomly selected areas for each tissue sample. *P < 0.05, **P < 0.01, Welch’s t test.

