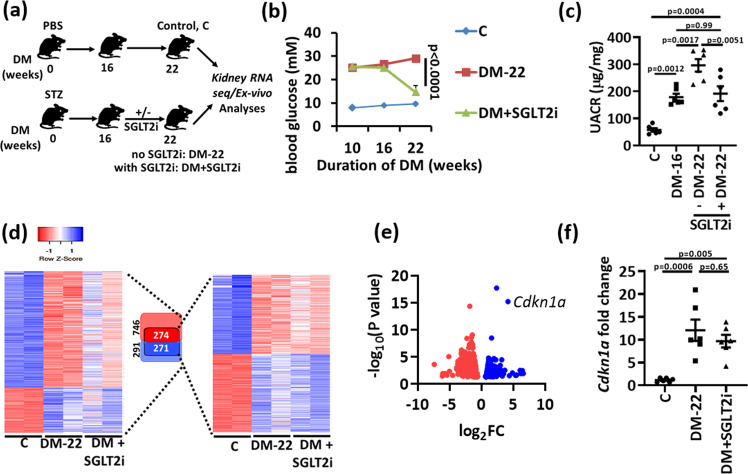
Fig. 1. Identification of genes and pathways associated with hyperglycemic memory.
a Experimental scheme showing non-diabetic control (C) or diabetic mice without (DM-22) or with intervention to reduce blood glucose levels by sodium/glucose cotransporter-2 inhibitor (Dapagliflozin®, DM + SGLT2i). Mice were age matched and SGLT2i treatment was started after 16 weeks of persistent hyperglycemia (streptozotocin; STZ-induced hyperglycemia). b Average blood glucose levels in the experimental groups after 10, 16 or 22 weeks. c Dot plot summarizing albuminuria (urinary albumin-creatinine ratio, µg albumin/mg creatinine; UACR) in non-diabetic (C) or diabetic mice without (DM-16 and DM-22) or with intervention to reduce blood glucose levels (DM + SGLT2i). d Heat map summarizing gene-expression in experimental groups (C, DM-22, DM + SGLT2i). All genes with significantly changed expression between control and diabetic mice are shown on the left side of the panel and are illustrated by lightly colored boxes in the middle (number of genes shown in black). The subset of genes with persistently changed expression despite reduced blood glucose levels are shown on the right side of the panel and illustrated by the darker colored smaller boxes in the middle (number of genes shown in white). e Volcano plot summarizing the persistently induced and repressed genes in diabetic mice after blood glucose reduction based on Log FC values and FDR. Ckdn1a (p21) belongs to the top persistently induced genes. f Sustained renal p21 mRNA expression (Cdkn1a, qRT-PCR) in vivo (DM-22; T1DM, STZ-model) despite reducing glucose levels (DM + SGLT2i; T1DM, STZ-model) as compared to mice with persistently elevated glucose levels (DM-22) or normoglycemic controls (C). Line graph and dot plots reflecting mean ± SEM of six mice per group; one-way ANOVA with Sidak’s multiple comparison test. Source data are provided as a Source Data file-Fig-1.

