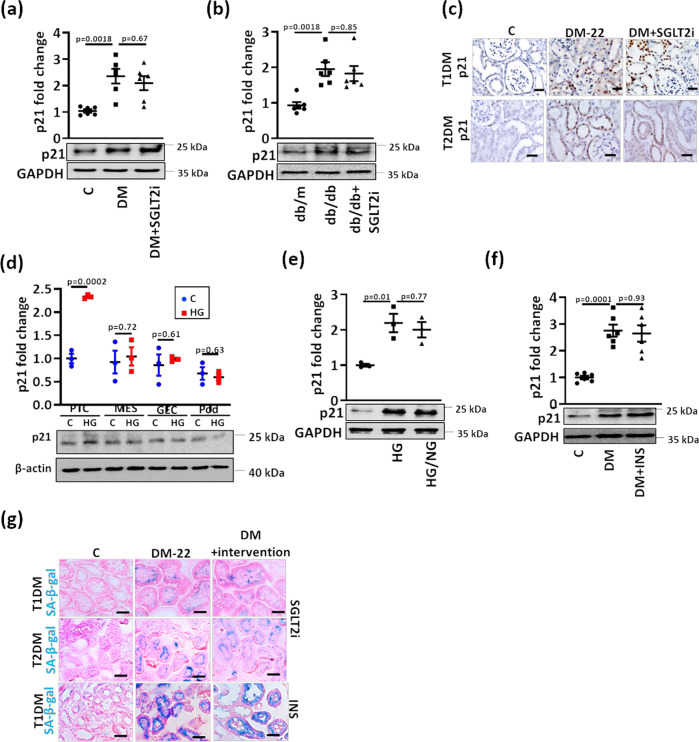
Fig. 2. Sustained p21 expression despite glucose lowering in experimental DKD.
a, b Sustained p21 expression in vivo (DM-22; T1DM, STZ-model, (a); T2DM, db/db-model, (b) despite reducing glucose levels (DM + SGLT2i, (a); db/db+SGLT2i, (b) as compared to mice with persistently elevated glucose levels (DM-22, (a); db/db, (b) or normoglycemic controls (C, a; db/m, b). Exemplary immunoblots (a, b). GAPDH: loading control (bottom, a, b) and dot plots summarizing results (top, a, b). c Immunohistochemical images of sustained p21 expression in kidneys of T1DM (STZ-model, top) and T2DM (db/db model, bottom) diabetic mice despite reducing glucose levels (DM + SGLT2i) as compared to mice with persistenly elevated blood glucose levels (DM-22); C: normoglycemic controls. p21 is detected by HRP-DAB reaction, brown; hematoxylin nuclear counter stain, blue. Scale bars represent 20 µm. d Exemplary p21immunoblot (bottom; loading control: β-actin) and dot plot summarizing results (top) in mouse primary tubular cells (PTC), mouse mesangial cells (MES), mouse glomerular endothelial cells (GEC), or mouse podocytes (Pod) maintained under normo- (5 mM; C) or high glucose (25 mM; HG) conditions. e Sustained p21 expression in vitro (Human kidney cells, HEK293) despite reducing glucose levels. HEK-293 cells were maintained under normal glucose (5 mM, C), high glucose (48 h of 25 mM, HG), or high glucose followed by normal glucose (25 and 5 mM, each for 24 h, HG/NG). Exemplary immunoblots (bottom, GAPDH: loading control) and dot plots summarizing results (top). f Sustained p21 expression in vivo (STZ-model) despite reducing glucose levels using insulin (DM + INS) as compared to mice with persistently elevated glucose levels (DM-22) and normoglycemic controls (C). Exemplary immunoblots (bottom, GAPDH: loading control) and dot plots summarizing results (top). g Exemplary histological images of SA-β-gal stain (senescence associated β-galactosidase, blue; eosin counterstain) in T1DM (STZ-model, top and bottom) and T2DM (db/db model, middle) despite reducing glucose levels (DM + intervention; SGLT2i, top and middle or insulin, INS, bottom) as compared to mice with persistently elevated glucose levels (DM-22) or normoglycemic controls (C). Scale bars represent 20 µm. Dot plots reflecting mean ± SEM of 6 mice per group or 3 independent experiments; one-way ANOVA with Sidak’s multiple comparison test (a,b,e,f); t-test comparing C versus HG for each cell line (d) Gels/blots were processed in parallel; source data are provided as a Source Data file-Fig-2.

