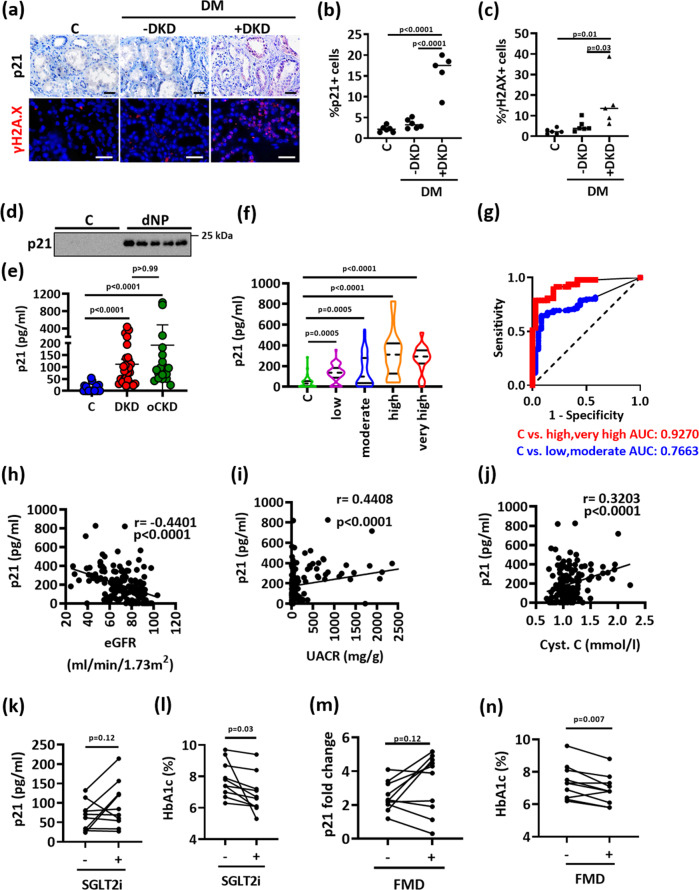
Fig. 3. Sustained tubular p21 expression in human DKD.
a–c Exemplary histological images of human kidney sections stained for p21 (top) or γ-H2A.X (histone H2A family X, bottom) obtained from non-diabetic controls (C; n = 6) or diabetic patients without (DM-DKD; n = 6) or with (DM + DKD; n = 5) DKD; p21 is detected by HRP-DAB reaction, brown; hematoxylin nuclear counter stain, blue; γ-H2A.X is immunofluorescently detected, red; DAPI nuclear counterstain, blue. Dot plots summarizing results for p21 (b) and γ-H2A.X (c); Scale bars represent 20 μm. one-way ANOVA with Sidak’s multiple comparison test. d, e Urinary p21, detected by immunoblotting (d) or ELISA (e; pg/ml) is markedly increased in patients with DKD (n = 26) compared to non-diabetic controls with normal kidney function (C; n = 22). Urinary p21 levels in patients with other causes of chronic kidney disease (oCKD; n = 18) are comparable to those in patients with DKD. Exemplary immunoblot (d) and dot plots reflecting mean ± SD showing the distribution of the urinary levels of p21 (e, Kruskal–Wallis test with Dunn’s multiple comparison test. f Violin plots showing the distribution of the urinary levels of p21 (pg/ml; ELISA) in normoglycemic controls (C; n = 36) and diabetic individuals which are classified according to KDIGO criteria from the LIFE-adult cohort (low risk, n = 52; moderate risk, n = 53; high risk, n = 29 and very high risk, n = 18). Kruskal-Wallis test with Dunn’s multiple comparison test. g Receiver operating characteristic (ROC) analyses of urinary p21 (pg/ml; ELISA) in diabetic individuals with low or moderate risk of CKD (blue) and in diabetic patients with high or very high risk of CKD (red) compared to non-diabetic controls (C). AUC: area under the curve. h–j Negative correlation of urinary p21 (pg/ml, ELISA) with estimated glomerular filtration rate (eGFR, ml/min/1.73 m², (h) and positive correlation with urinary albumin creatinine ration (UACR, mg albumin /g creatinine, (i) or with cystatin C serum levels (Cyt. C, mmol/l, j) in diabetic individuals from the LIFE-adult cohort. Pearson’s correlation. k–n line-graphs illustrating individual changes of urinary p21 (k; ELISA, pg/ml, m; immunoblot) or HbA1c (l, n) in diabetic patients with known DKD (n = 10) before (−) and after (+) SGLT2i treatment (k, l) or before (−) and after (+) fasting mimicking diet (FMD, m, n). Paired t-test. Gels/blots were processed in parallel; source data are provided as a Source Data file-Fig-3.

