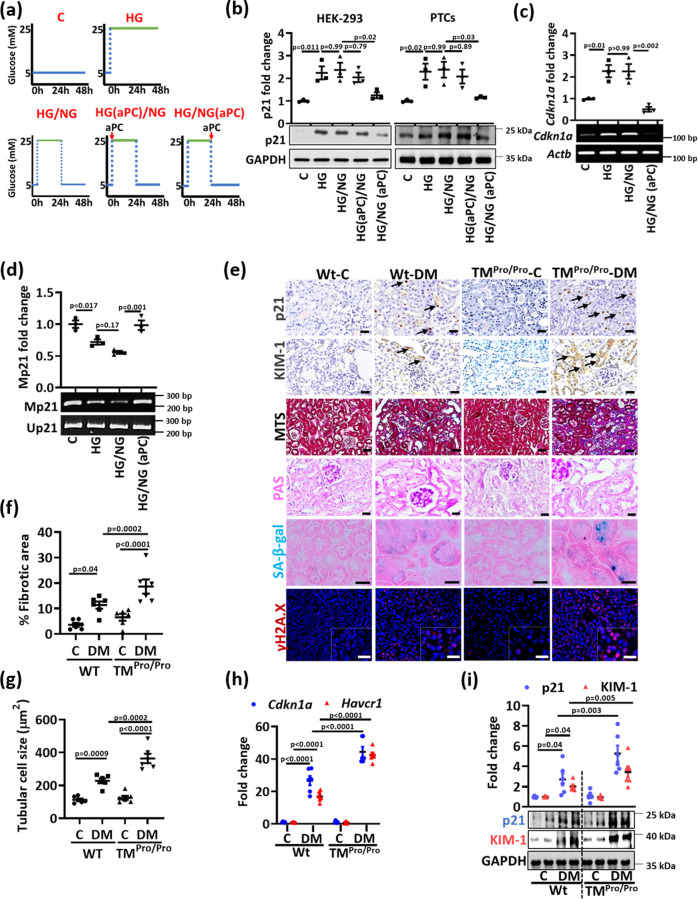
Fig. 4. Impaired protein C activation increases tubular p21 expression and senescence in vivo.
a Experimental scheme of in vitro experiments with human kidney cells (HEK-293) or mouse primary tubular cells (PTCs). Experimental conditions: control with continuously normal glucose (C, 5 mM glucose), continuously high glucose (HG, 25 mM, 48 h), high glucose for 24 h followed by normal glucose (NG, 5 mM glucose) for 24 h without aPC-exposure (HG/NG), with aPC (20 nM) during the high glucose exposure (HG(aPC)/NG), or with aPC (20 nM) upon returning cells to normal glucose (HG/NG(aPC)). b Exemplary immunoblots of p21 (bottom; loading control: GAPDH) in HEK-293 cells and mouse PTCs and dot plots summarizing results (top). Experimental conditions as described in (a). c, d Exemplary images (bottom) and dot plots summarizing results (top) of p21 (Cdkn1a) mRNA-levels determined by semiquantitative RT-PCR (control: β-actin, Actb; c) and methylation-specific PCR (d) of the p21-promoter (Mp21; control: unmethylated p21, Up21) in HEK-293 cells (experimental conditions as described in a). e Exemplary histological images from non-diabetic (C) or diabetic (DM) wild-type (Wt) and TMPro/Pro mice for p21 (immunohistochemically detected by HRP-DAB-reaction, brown, examples illustrated by arrows; hematoxylin counterstain), interstitial fibrosis (Masson’s trichrome stain, MTS), periodic acid Schiff stain (PAS), SA-β-gal. stain (senescence associated β-galactosidase, blue; eosin counterstain), and γ-H2A.X immunohistochemistry (histone H2A family X, red; DAPI nuclear counterstain, insets: larger magnification); all scale bars represent 20 μm. f, g Dot plots summarizing tubular fibrotic area (f) and tubular cell size (g) in experimental groups (as described in (e). h Dot plot summarizing renal p21 (Cdkn1a) and KIM-1 (Havcr1) expression (mRNA, qRT-PCR) in experimental groups (as described in e). i Representative immunoblots (bottom; loading control: GAPDH) and dot plot summarizing results (top) for renal p21 and KIM-1 expression in experimental groups (as described in e). Dot plots reflecting mean ± SEM of 3 independent experiments (b–d) or 6 mice per group (f–i); one-way ANOVA with Sidak’s multiple comparison test (b–d) or two-way ANOVA with Sidak’s multiple comparison test (f–i). Gels/blots were processed in parallel; source data are provided as a Source Data file-Fig-4.

