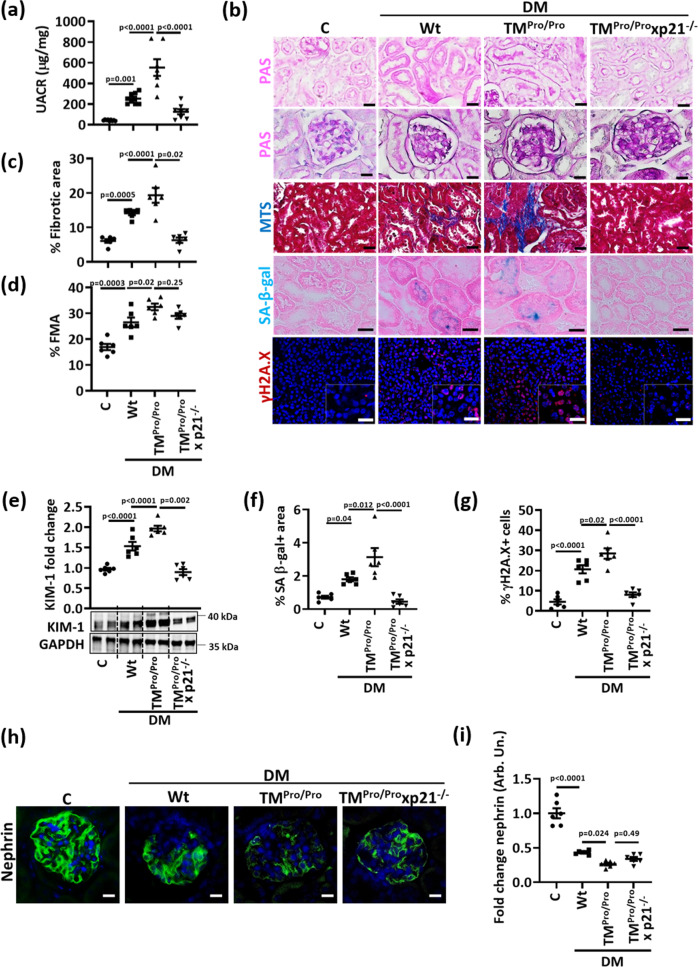
Fig. 5. p21 mediates enhanced tubular senescence in aPC-deficient mice.
a Dot plot summarizing albuminuria (urinary albumin-creatinine ratio, µg albumin/mg creatinine; UACR) in non-diabetic (C, n = 9) or diabetic (DM) wild-type (Wt, n = 8), TMPro/Pro (n = 7) and TMPro/Pro x p21−/− (n = 8) mice. b Exemplary histological images of periodic acid Schiff stains (PAS) showing tubuli (top) or glomeruli (2nd row), interstitial fibrosis (Masson’s trichrome stain, MTS), SA-β-gal. stain (senescence associated β-galactosidase, blue; eosin counterstain), and γ-H2A.X immunohistochemistry (histone H2A family X, red; DAPI nuclear counterstain, insets: larger magnification) in experimental groups (as described in a); all scale bars represent 20 μm. c, d Dot plots summarizing tubular fibrotic area (c) and fractional mesangial area (FMA, d), the latter reflecting glomerulosclerosis in experimental groups (as described in a). e Exemplary immunoblot (bottom; loading control: GAPDH) and dot plot summarizing results (top) of renal KIM-1 expression in experimental groups (as described in a). f, g Dot plots summarizing percentage of SA-β-gal. positive area (f) and percentage of γ-H2A.X positive cells (g) in experimental groups (as described in a). h, i Exemplary histological images of glomerular nephrin expression (green, DAPI nuclear counterstain, blue, h), and dot plot summarizing nephrin staining intensity fold change (i) in experimental groups (as described in a). Dot plots reflecting mean ± SEM of six mice per group; one-way ANOVA with Sidak’s multiple comparison test. Source data are provided as a Source Data file-Fig-5.

