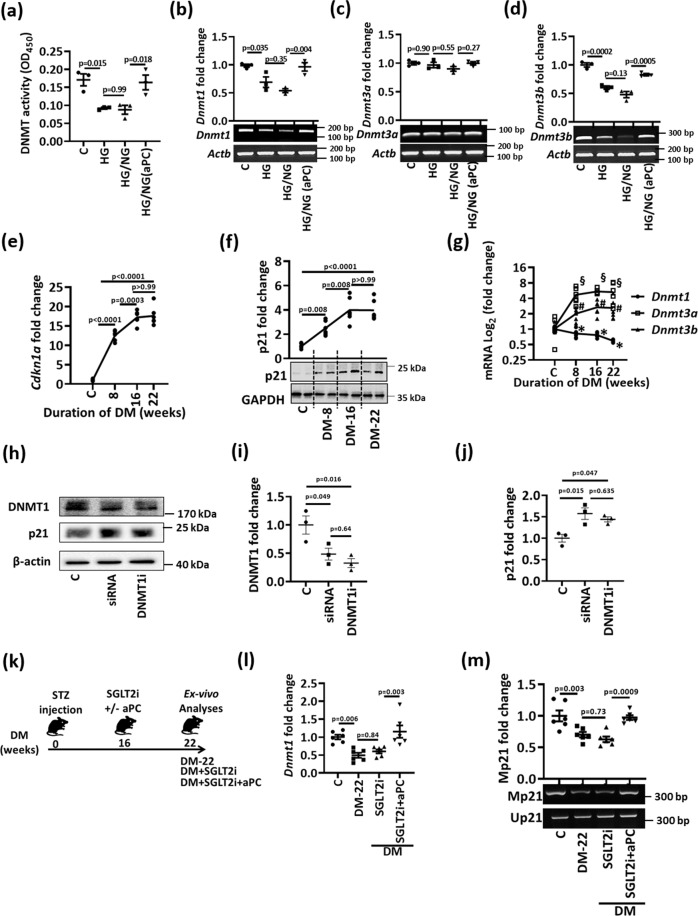
Fig. 6. aPC regulates p21 promoter methylation and DNMT1 in tubular cells.
a Dot-plot summarizing total DNMT-activity in HEK-293 cells. Experimental conditions: control with continuously normal glucose (C, 5 mM glucose), continuously high glucose (HG, 25 mM, 48 h), high glucose for 24 h followed by normal glucose (NG, 5 mM glucose) for 24 h without aPC-exposure (HG/NG), or with aPC (20 nM) upon returning cells to normal glucose (HG/NG(aPC)). b–d Exemplary gel-images of Dnmt1 (b), Dnmt3a (c), and Dnmt3b (d); (bottom; semi-quantitative RT-PCR, loading control: β-actin, Actb) expression and dot-plots summarizing results (top) in experimental conditions (as described in a). e–g Kinetics of renal p21 (Cdkn1a) expression (e, mRNA, qRT-PCR; f, protein expression). Exemplary immunoblot (f, bottom; GAPDH: loading control) and line-graph summarizing results (top). Line-graph summarizing Dnmt1, Dnmt3a and Dnmt3b expression in vivo (g, mRNA, qRT-PCR). Diabetic wild-type mice (STZ model, age 8, 16, or 22 weeks) were compared to non-diabetic mice (C, age 30 weeks). *P = 0.022 (C vs 8), *P = 0.002 (C vs 16), *P < 0.0001 (C vs 22). #P = 0.001 (C vs 8), #P = 0.0002 (C vs 16), #P = 0.0003 (C vs 22). §P = 0.15 (C vs 8), §P = 0.007 (C vs 16), §P = 0.011 (C vs 22). h–j Exemplary immunoblots of DNMT1 and p21 (β-actin: loading control) in murine primary tubular cells (h) and dot-plots summarizing results of DNMT1 (i) and p21 (j). Experimental conditions: control (C), DNMT1 siRNA (24 h, siRNA), and DNMT1 vivo morpholino (10 µM, 24 h, DNMT1(i). k Experimental scheme: 16 weeks after induction of persistent hyperglycemia with STZ, diabetic mice were treated with PBS (DM-22), sodium/glucose cotransporter 2-inhibitor (Dapagliflozin®, DM + SGLT2i) or a combination of SGLT2i and aPC (DM + SGLT2i + aPC) for further 6 weeks. l, m Dot-plots summarizing renal Dnmt1 expression (i, mRNA, qRT-PCR), and exemplary images of methylation-specific PCR (j, bottom) and dot-plot summarizing results (j, top) of p21-promoter (Mp21; control: unmethylated p21, Up21) in experimental groups (as described in h). Dot-plots or line-graphs reflecting mean ± SEM of three independent experiments (a–d, i, j), 4 mice per group (e–g), or 6 mice per group (i, m); one-way ANOVA with Sidak’s multiple comparison test. Gels/blots were processed in parallel; source data are provided as a Source Data file-Fig-6.

