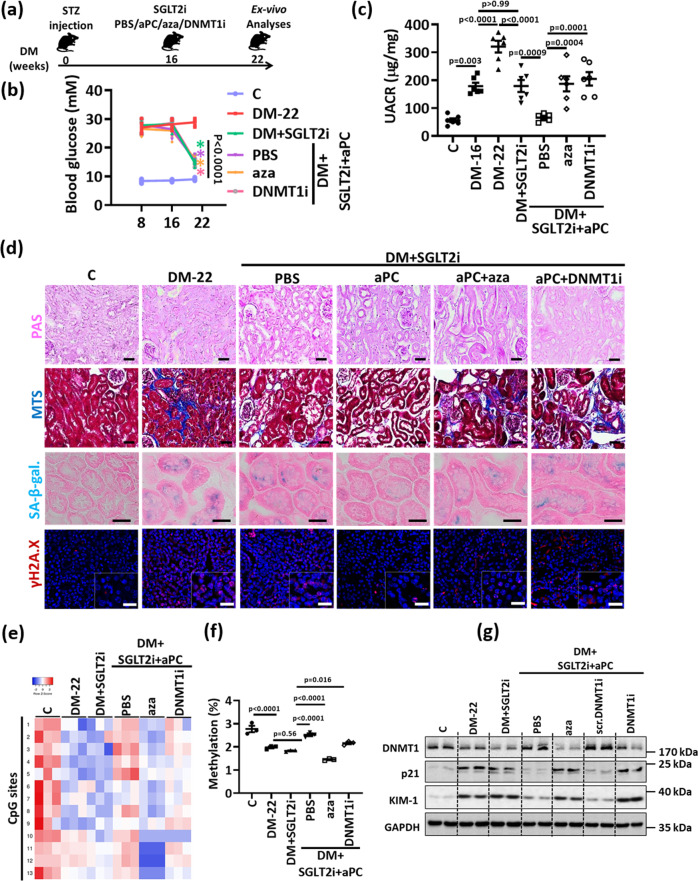
Fig. 7. aPC reverses epigenetically sustained renal p21 expression and tubular senescence.
a Experimental scheme: 16 weeks after induction of persistent hyperglycemia, diabetic mice were treated with PBS (DM-22), sodium/glucose cotransporter 2-inhibitor (Dapagliflozin®, DM + SGLT2i), a combination of SGLT2i and aPC (DM + SGLT2i + aPC), a combination of SGLT2i, aPC and the pan DNMTs-inhibitor 5-aza-deoxycytidine (DM + SGLT2i + aPC+aza), or a combination of SGLT2i, aPC and a vivo morpholino targeting DNMT1 (DM + SGLT2i-aPC-DNMT1i) for further 6 weeks. b Average blood glucose levels in experimental groups (as described in a) after 8 or 16 weeks of persistent hyperglycemia and at 22 weeks. c Dot plot summarizing albuminuria (urinary albumin-creatinine ratio, µg albumin/mg creatinine; UACR) in experimental groups (as described in a). Baseline albuminuria before interventions was determined after 16 weeks of hyperglycemia (DM-16). d Exemplary histological images of periodic acid Schiff stains (PAS), interstitial fibrosis (Masson’s trichrome stain, MTS), SA- β-gal. stain (senescence associated β-galactosidase, blue; eosin counterstain), and γ-H2A.X (histone H2A, family X, immunohistochemistry, red; DAPI: nuclear counterstain, insets: larger magnification) in experimental groups (as described in a); scale bars represent 20 μm; all scale bars represent 20 μm. e, f Heat map summarizing methylation status of CpG sites in the p21 promotor region (e, the degree of methylation at each CpG site is represented according to the color code.) and dot plot summarizing cumulative quantification CpG islands’ methylation (f) in kidneys of experimental groups (as described in a). g Expression of renal p21, DNMT1 and KIM-1 protein (exemplary immunoblot, g; loading control: GAPDH in experimental groups (as described in a). A nonspecific scrambled vivo morpholino (scr. DNMT1i) has no effect. Line graph and dot plots reflecting mean ± SEM of 6 mice per group; one-way ANOVA with Sidak’s multiple comparison test. Gels/blots were processed in parallel; source data are provided as a Source Data file-Fig-7.

