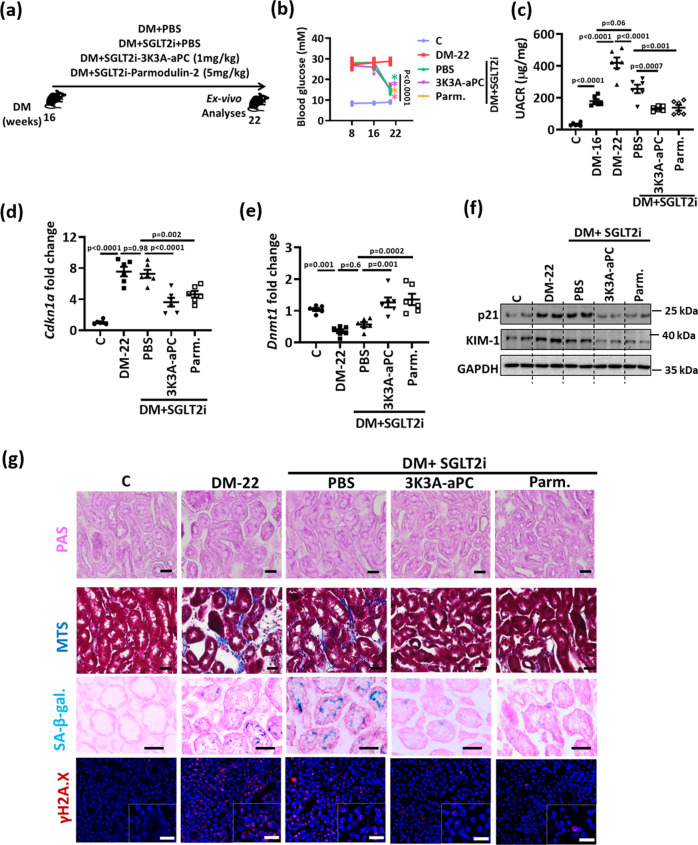
Fig. 8. aPC regulates epigenetically sustained p21 expression independent of its anticoagulant function.
a Experimental scheme: 16 weeks after induction of persistent hyperglycemia, diabetic mice were treated with PBS (DM + PBS), sodium/glucose cotransporter 2-inhibitor (Dapagliflozin®, DM + SGLT2i), a combination of SGLT2i and 3K3A-aPC (DM + SGLT2i + 3K3A-aPC) or a combination of SGLT2i, aPC and parmodulin-2 (DM + SGLT2i + Parm.) for further 6 weeks. b Average blood glucose levels after 8 and and16 weeks of persistent hyperglycemia and at 22 weeks in experimental groups (as described in a). c Dot plot summarizing albuminuria (urinary albumin-creatinine ratio, µg albumin/mg creatinine; UACR) in experimental groups (as described in a). Baseline albuminuria before interventions was determined after 16 weeks of hyperglycemia (DM-16). d–f Expression of renal p21 mRNA (Cdkn1a, qRT-PCR, d; and protein, f), renal DNMT1 mRNA (Dnmt1, qRT-PCR, e), and renal KIM-1 (protein, f) in experimental groups (as described in a). Exemplary immunoblots (f; GAPDH: loading control). g Exemplary histological images of periodic acid Schiff stain (PAS), interstitial fibrosis (Masson’s trichrome stain, MTS), SA- β-gal. stain (senescence associated β-galactosidase), and γ-H2A.X (histone H2A, family X, red, immunofluorescent, DAPI nuclear counterstain, insets: larger magnification) in experimental groups (as described in a); all scale bars represent 20 μm. Line graph or dot plots reflecting mean ± SEM of six mice per group; one-way ANOVA with Sidak’s multiple comparison test. Gels/blots were processed in parallel; source data are provided as a Source Data file-Fig-8.

