
Figure 2.
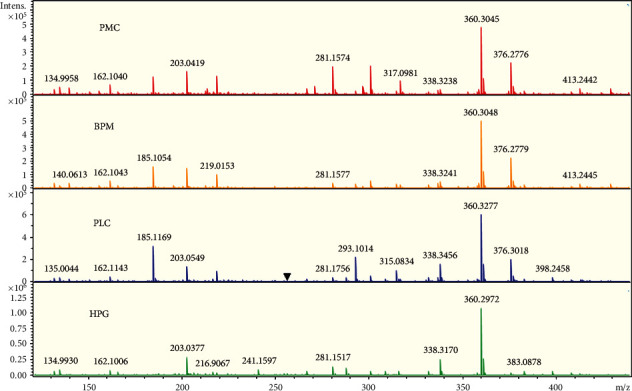
From top to bottom are the typical peak spectra of samples from PMC, BPN, PLC, and HPG, respectively. The X-axis represents the m/z value, which can be understood as the molecular weight of the substance; different m/z values represent the relevant low-molecular metabolites; the Y-axis represents the absolute intensity value of the substance contained in the sample. Comparing the four groups visually, it can be seen that most of the low-molecular metabolites are present in the four groups, but the absolute intensity values are different in various samples. There are some low-molecular metabolites that are unique to a certain sample or not present in a certain sample. The main reason is that the absolute intensity value is extremely low, causing the peak height too low to be identified in the figure.