
Figure 7.
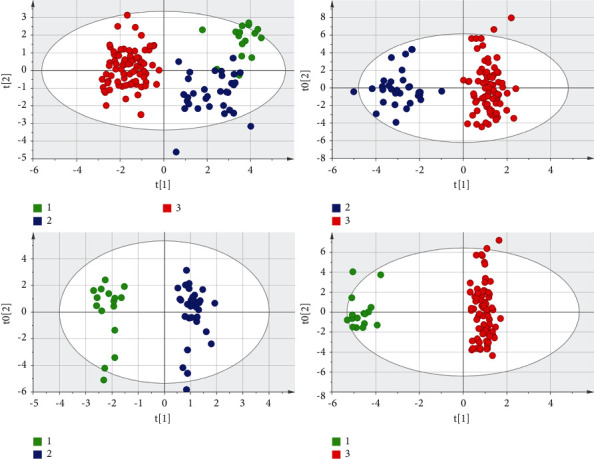
The score scatter plots of the overall comparison of the three pulmonary nodule groups and the pairwise comparisons are shown. It can be seen intuitively that the differences among the three groups are obvious. The number 1, 2, and 3 in the figures represent PMC, BPN, and PLC, respectively.