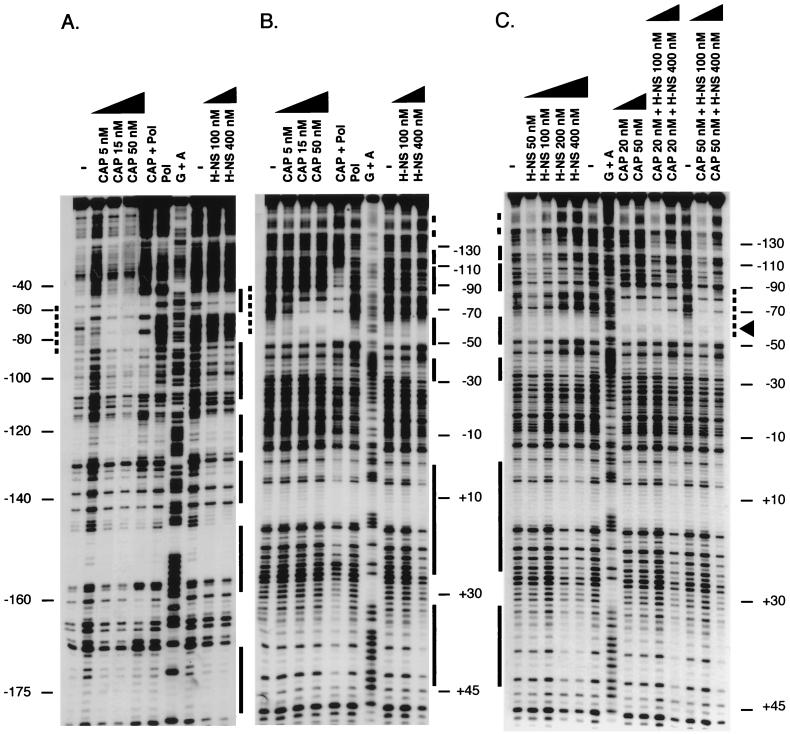
FIG. 5.
Analysis of CAP and H-NS binding to the flhDC promoter by DNase I footprinting assays. (A) The labeled DNA fragment represents the coding strand; (B) DNA fragment labeled at the noncoding strand; (C) binding to the noncoding strand was examined in the presence of both regulators. The CAP binding sites are indicated by dotted lines. The regions protected by H-NS are marked by solid lines. The region where both regulators interact is highlighted by an arrowhead. Lanes G+A contain the products of a sequencing reaction used to determine the coordinates (to the left of panel A and to the right of panels B and C) of the regions protected against DNase I cleavage relative to the transcription start site. Above the lanes, the CAP or H-NS concentrations used in the experiment are indicated. Pol, RNA polymerase was present in the reaction mixture; −, no protein was present.

