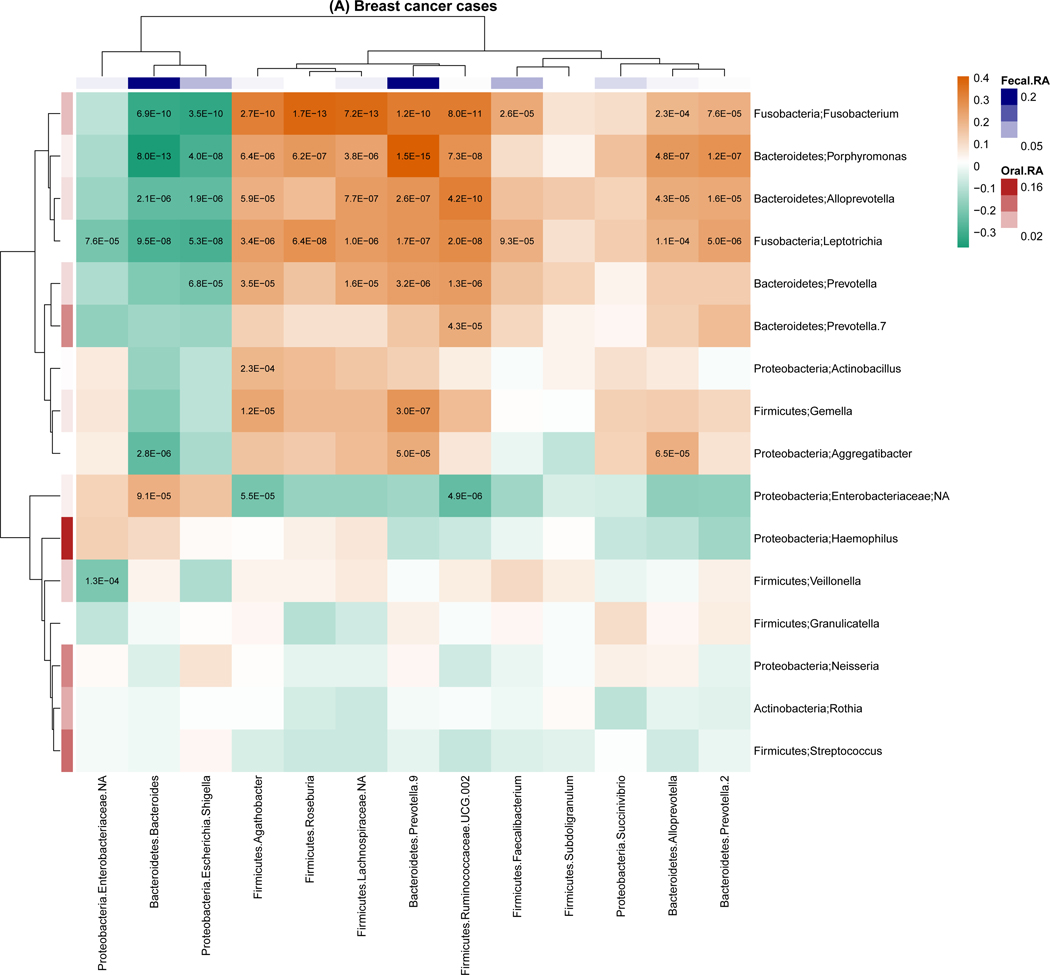
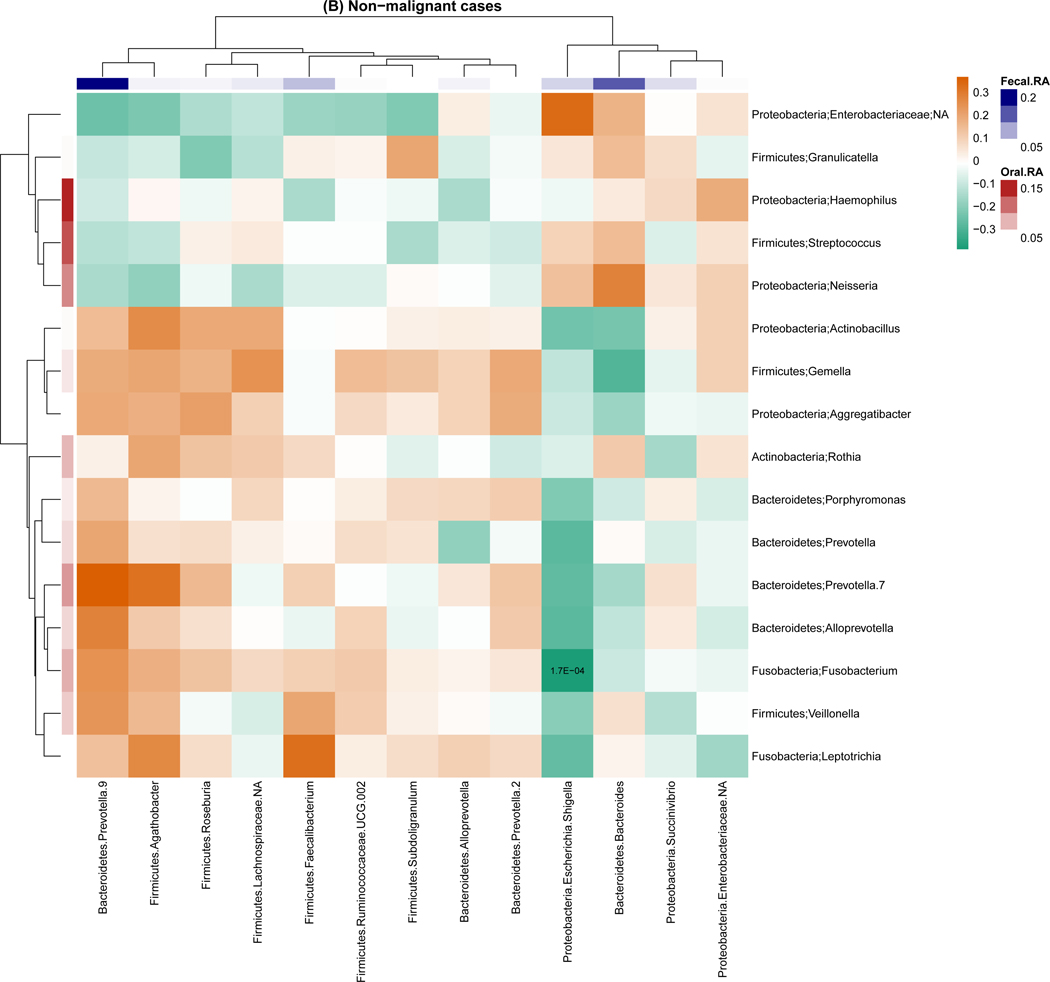
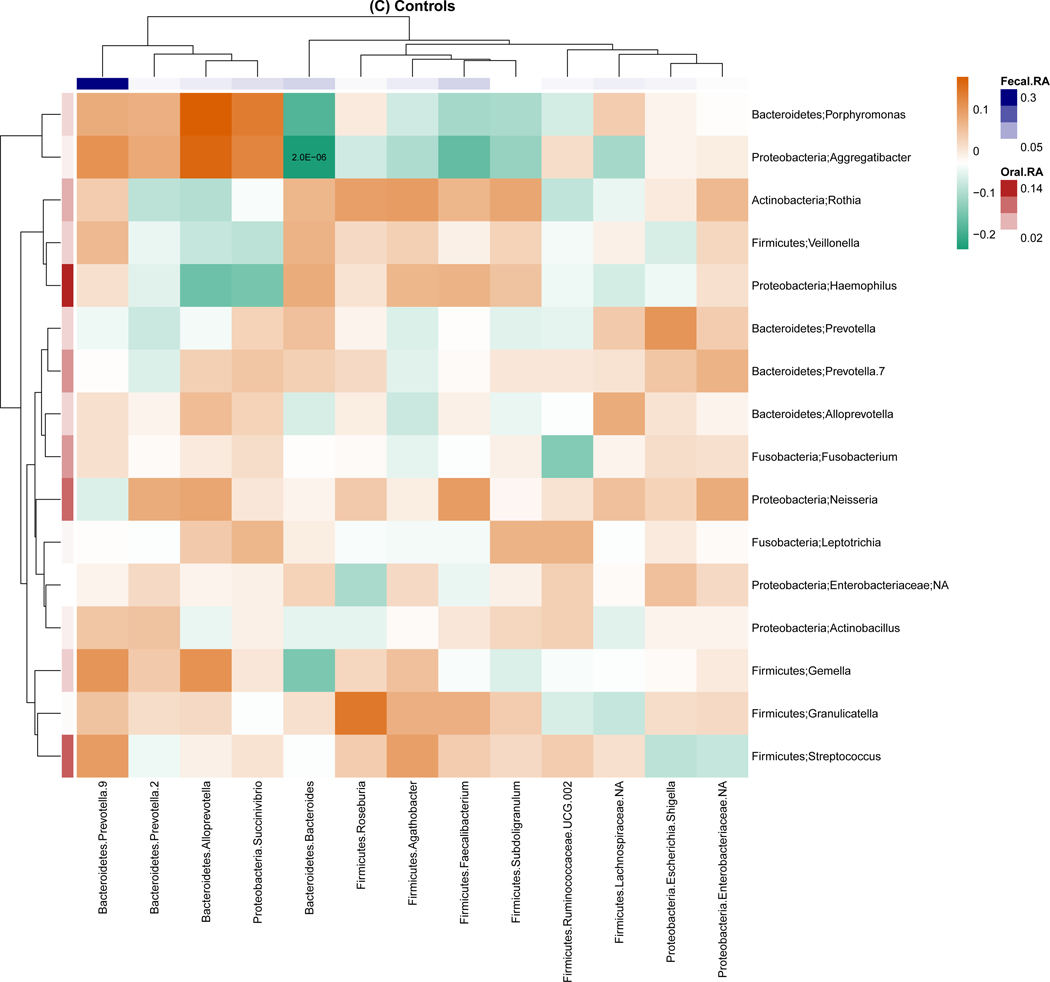
Figure 2.
Genus-level relative abundance correlations between the oral and fecal microbiome within breast cancer cases (A), non-malignant cases (B), and controls (C). Taxa were present with a mean relative abundance of greater than 1% of the population. Color of the cells (orange to green) indicates the scale of correlation coefficients, and the number in the cell is the corresponding p-value below the Bonferroni adjusted threshold p < 0.05/(13 × 16) = 2.4E-04. Fecal.RA, relative abundance of fecal taxa, Oral.RA, relative abundance of oral taxa.


