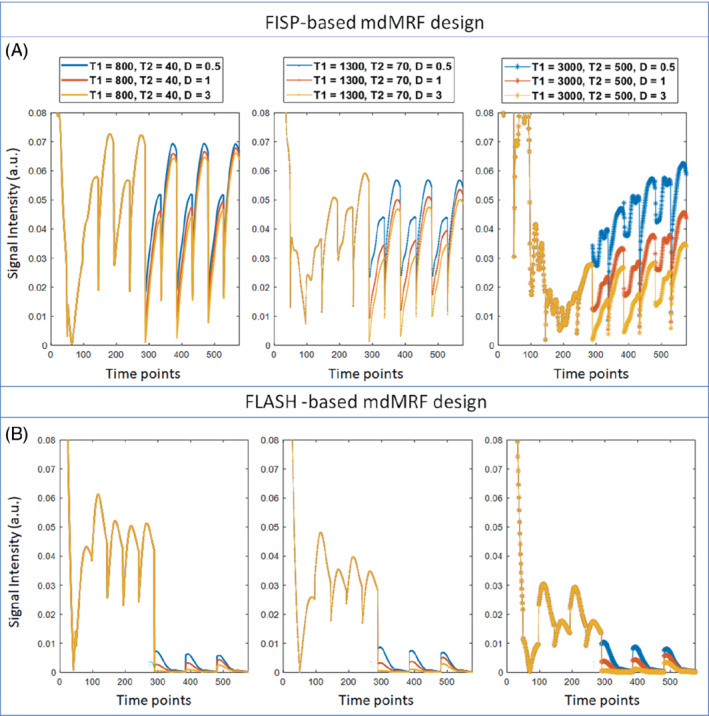
FIGURE 2.

The signal evolutions simulated from the mdMRF scans with the FISP‐based (A) and FLASH‐based (B) MRF readout designs. The first 288 time points were from three acquisition segments with T1 and T2 preparations while the latter 288 time points were from three segments with diffusion preparations with b = 1000, 700, and 300 s/mm2, respectively. Signals from each column have the same T1 and T2 values based on white matter (T1 = 800 ms, T2 = 40 ms), gray matter (T1 = 1300 ms, T2 = 70 ms), and CSF (T1 = 3000 ms, T2 = 500 ms), and different colors represent different diffusion coefficient values (D = 0.5, 1, and 3 um2/ms)
