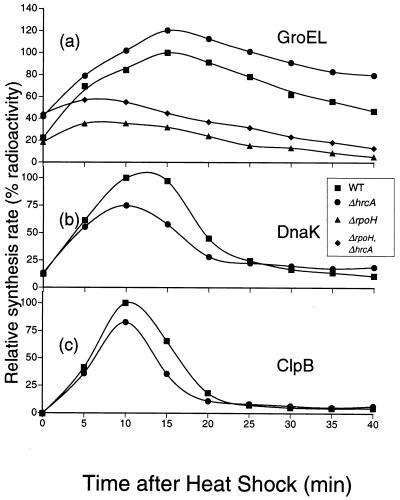
FIG. 6.
Kinetics of HSP induction upon temperature upshift. Radioactivity associated with the protein bands of the three major HSPs shown in Fig. 3 were quantified to analyze the kinetics of induction. (a) GroEL; (b) DnaK; (C) ClpB. The radioactivity of each band was plotted after normalization to the maximum synthesis rate in the wild type, set at 100. DnaK and ClpB in the ΔrpoH and ΔhrcA ΔrpoH mutants were not plotted, as they were below the background levels. ■, GV3101 (wild type); ▴, KN501 (ΔrpoH); ●, KN613 (ΔhrcA); ⧫, KN201 (ΔhrcA ΔrpoH).

