
Figure 4:
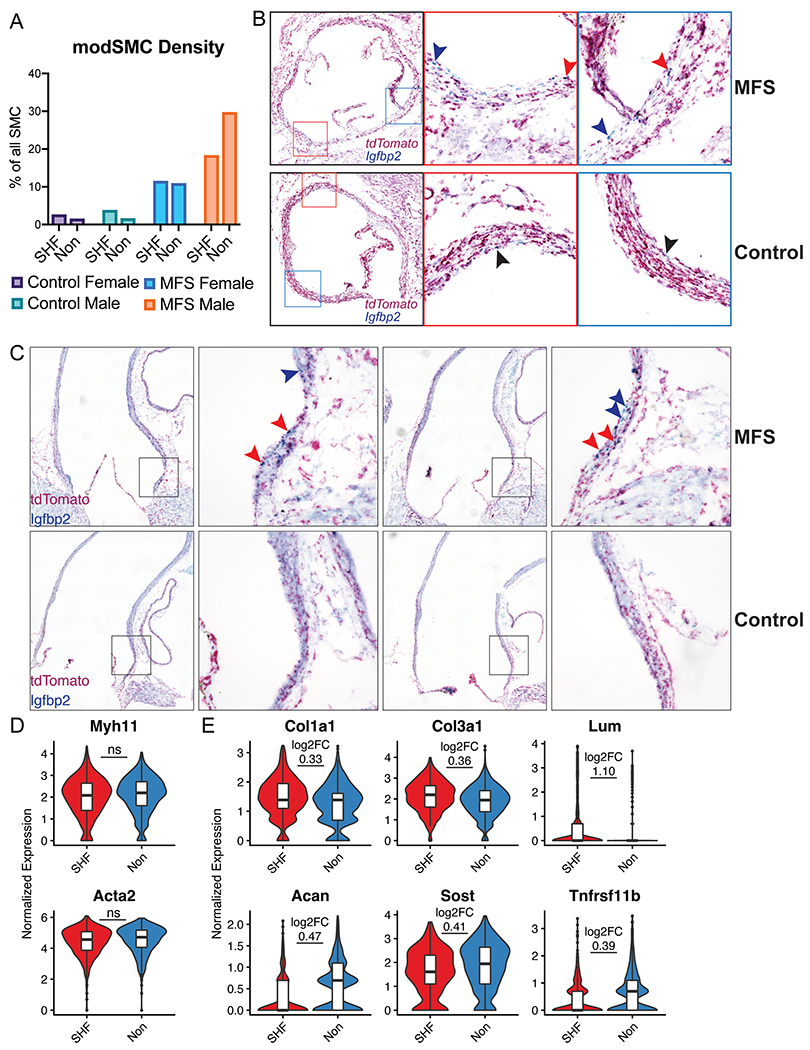
Modulated SMC localization and phenotype stratified by lineage. A Proportion of all SMCs belonging to modSMC cluster by sample. SHF=lineage traced second heart field-derived cells, Non=untraced cells. B Short axis chromogenic RNA in-situ hybridization for SHF lineage marker (tdTomato) and insulin-like growth factor binding protein-2 (Igfbp2), a specific marker for the modSMC subset. 16-week-old MFS animals show modSMCs from both SHF (double stain, red arrowheads) and non-traced (blue stain only, blue arrowheads) while control animals demonstrate rare Igfbp2-positive cells (black arrowheads). Left image is stitched image of entire root circumference with boxes marking inset 20X magnification images. C Long-axis RNA localization shows modSMCs are concentrated in the MFS aortic root segment regardless of lineage (SHF-derived = red arrowheads, non-traced = blue arrowheads) while control animals show trivial Igfbp2 expression D Myh11 and Acta2 expression levels are similar between MFS modSMCs from SHF and non-traced lineages E Multiple collagen isoforms and proteoglycans are enriched in SHF-derived modSMCs (top panel) while Acan, Sost, and Tnfrsf11b are enriched in non-traced modSMCs (bottom). Boxes denote interquartile range (IQR), line denotes median, whiskers extend 1.5 IQR from box hinges. ‘ns’ indicates fold change not calculated between lineages due to non-significant difference, otherwise p < 0.001 for all genes with log2FC displayed.