
FIGURE 2.
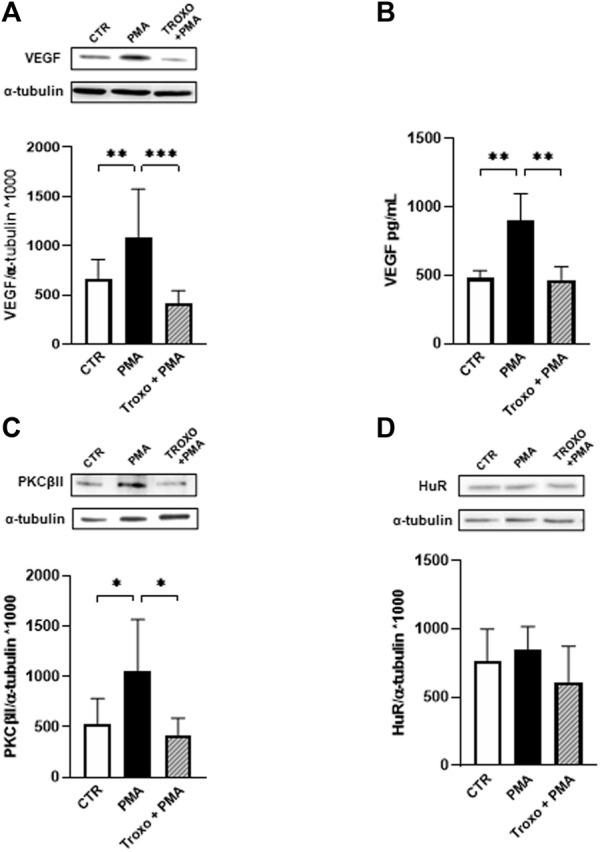
Effect of PMA and troxerutin on VEGF intracellular content (A) and on its release in the medium (B) in HUVEC. HUVEC were co-exposed to PMA (100 nM) and troxerutin (1 mM) for 48 h. The results are expressed as mean grey levels ratios (mean ± S.D.) of VEGF/α-tubulin immunoreactivities × 1000 measured by Western blotting [(A); upper side: cropped Western blotting images and lower side: densitometric analysis] and VEGF amount in pg/mL (mean ± S.D.) evaluated by ELISA (B). Effect of PMA and troxerutin on PKCβII (C) and HuR (D) intracellular content in HUVEC. HUVEC were co-exposed to PMA (100 nM) and troxerutin (1 mM) for 48 h. The results are expressed as mean grey levels ratios (mean ± S.D.) of PKC βII/α-tubulin and HuR/α-tubulin immunoreactivities × 1000 measured by Western blotting (upper side a cropped Western blotting image and lower side densitometric analysis). *p < 0.05, **p < 0.01, ***p < 0.001, Dunnett’s Multiple Comparisons test, n = 4–8 independent experiments for both intracellular and medium levels. CTR, control; PMA, phorbol 12-myristate 13-acetate; Troxo, troxerutin.