
FIGURE 4.
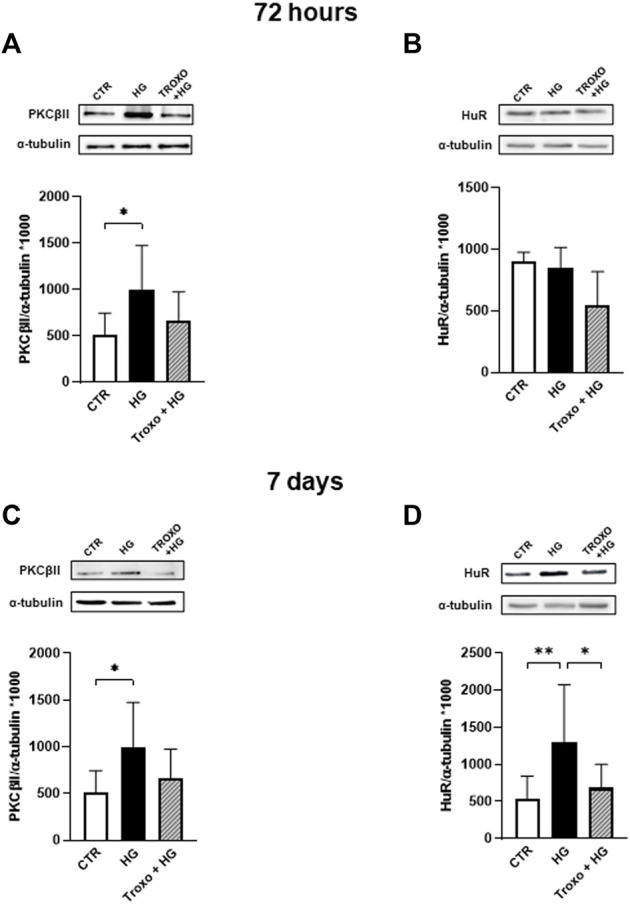
Combined effect of high glucose and troxerutin on PKCβII and HuR in HREC. PKCβII and HuR were evaluated in the total homogenates of HREC following exposure for 72 h (A,B) and 7 days (C,D) to high glucose levels (25 mM) with or without troxerutin (1 mM). Upper side: cropped Western blotting images. Lower side: densitometric analysis. The results are expressed as mean grey levels ratios (mean ± S.D.) of PKCβII/α-tubulin and HuR/α-tubulin immunoreactivities × 1000 measured by Western blotting. *p < 0.05, **p < 0.01, Dunnett’s Multiple Comparisons test, n = 4–8 independent experiments. CTR, control; HG, high glucose; Troxo, troxerutin.