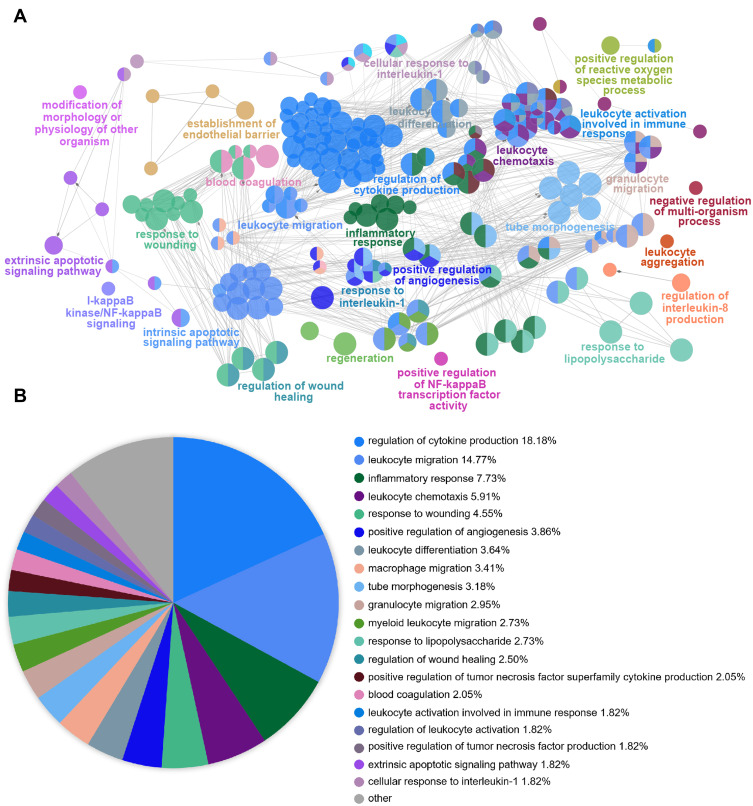
Figure 4.
Functional Enrichment Analysis of DEGs using ClueGO. (A) ClueGO was used to analyze the interaction network of enriched biological processes; multiple color dots imply that a DEG is involved in multiple biological processes. (B) The pie charts show the enrichment of various biological processes; the gray sector represents paths with a proportion < 1.8%.

