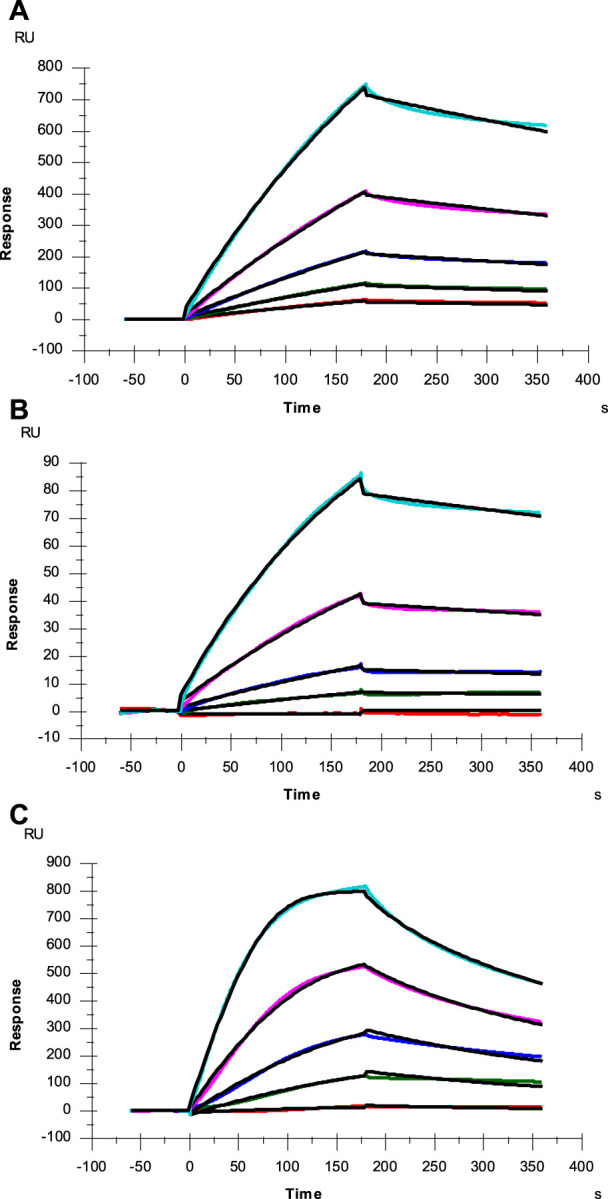
FIGURE 3.

SPR sensorgrams of SGP-RBD of WT, Delta and Omicron variants interaction with heparin. Concentration of SGP-RBD mutants (from top to bottom): 1000, 500, 250, 125, and 63 nM, respectively. The black curves are the fitting curves using models from Biacore T200 Evaluation software (A) WT; (B) Delta; (C) Omicron.
