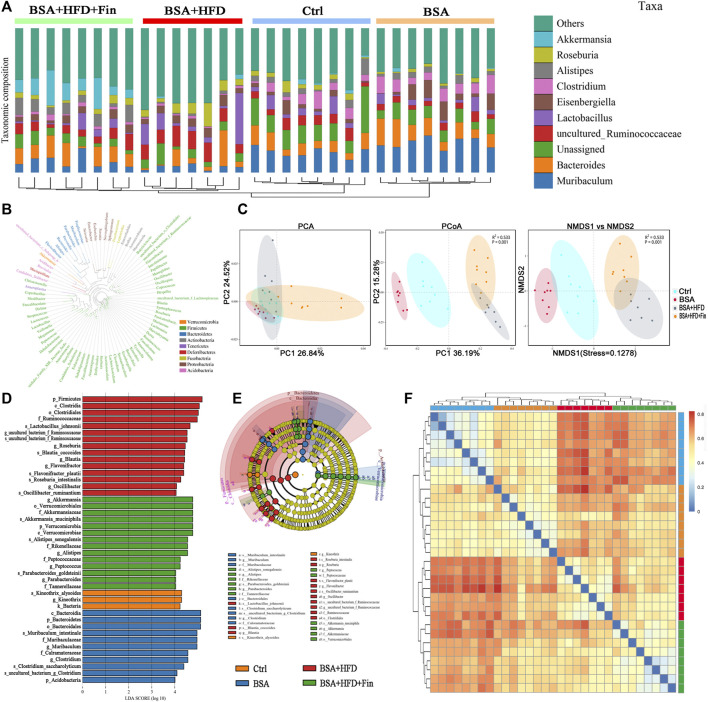
FIGURE 5.
Specific microbiome populations in each group of mice. (A) Combined UPGMA clustering tree and histograms of the gut microbiota of the mice in each group. (B) Phylogenetic tree based on the OTUs in each sample at the genus level. (C) Beta diversity analysis of the OTU distribution in each sample. (D) Heatmap analysis on the gut microbiota of mice in each group. (E) (F) Line discriminant analysis (LDA) effect size analysis of the gut microbiota in each sample.

