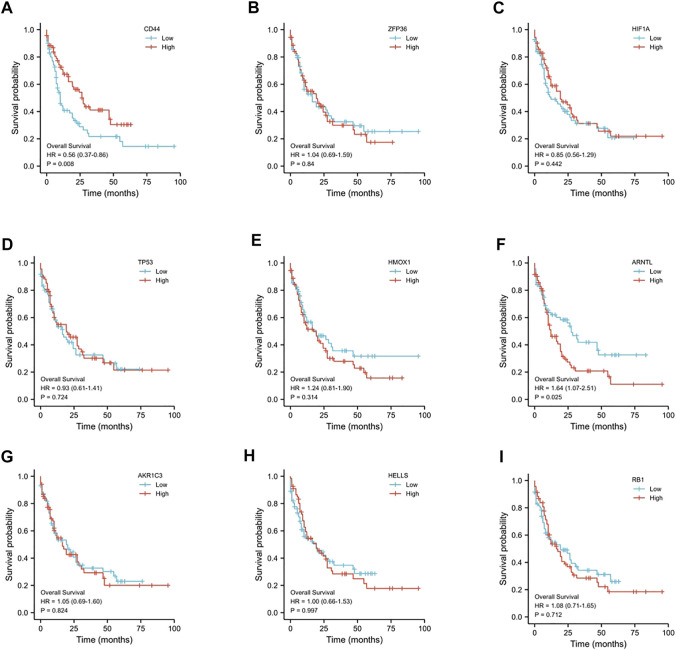
FIGURE 2.
Prognostic value of the 9-ferroptosis-related-gene signature in AML patients. (A) Kaplan–Meier curves for the overall survival of high- and low-CD44 expression AML patients; (B) Kaplan–Meier curves for the overall survival of high- and low-ZFP36 expression AML patients; (C) Kaplan–Meier curves for the overall survival of high- and low-HIF1A expression AML patients; (D) Kaplan–Meier curves for the overall survival of high- and low-TP53 expression AML patients; (E) Kaplan–Meier curves for the overall survival of high- and low-HMOX1 expression AML patients; (F) Kaplan–Meier curves for the overall survival of high- and low-ARNTL expression AML patients; (G) Kaplan–Meier curves for the overall survival of high- and low-AKR1C3 expression AML patients; (H) Kaplan–Meier curves for the overall survival of high- and low-HELLS expression AML patients; (I) Kaplan–Meier curves for the overall survival of high- and low-RB1 expression AML patients. p < 0.05 is considered as significant.

