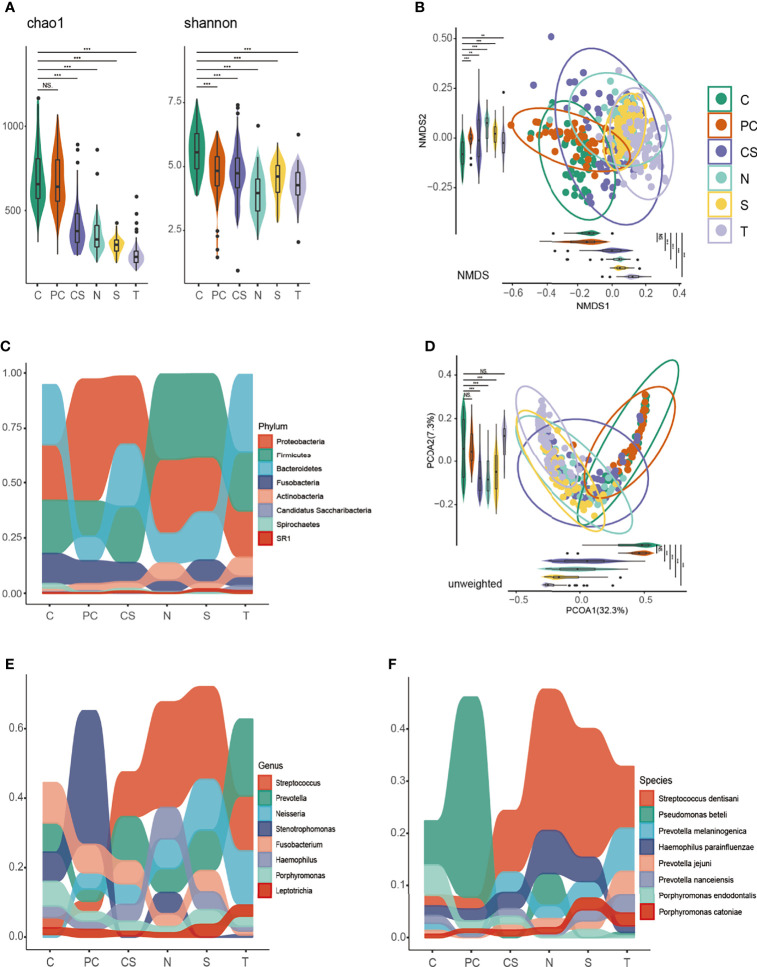
Figure 1.
Diversity analysis and taxonomy distribution of the oral microbiome among six niches. Bacterial richness, evenness and diversity were evaluated by (A) Chao 1 and Shannon index. Clusters formed by (B) non-metric multidimensional scaling (NMDS) and (D) principal coordinate analysis (PCoA) based on unweighted UniFrac. Differential taxonomy distribution at the (C) phylum, (E) genus and (F) species level. C, tumor tissue; PC, paracancerous tissue; CS, cancer surface; N, anatomically matched contralateral normal mucosa; S, saliva; T, tongue coat. ns, no significance; **P < 0.005, ***P < 0.001.

