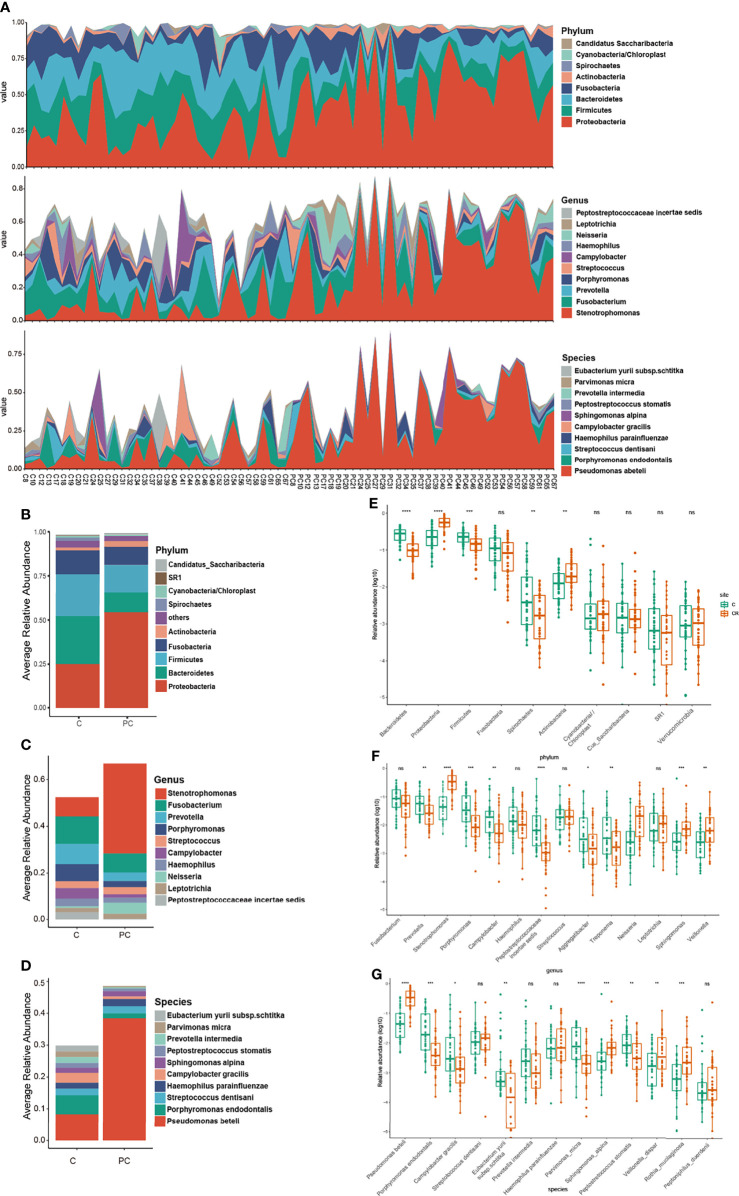
Figure 2.
(A) The comparison of taxonomic composition between tumor and paracancerous tissue samples. Distribution of relative abundance of microbiome in the tumor tissue and paracancerous tissue of each OSCC subject at the phylum, genus, and species level. Histograms described relative abundances of the (B) top 10 phylum, (C) 10 genera, and (D) top 10 species in the tumor tissue and paracancerous tissue. (E–G) Prevalence of bacterial phylum, genera and species associated with tumor and paracancerous tissue of OSCC subjects. C, tumor tissue; PC, paracancerous tissue. ns, no significance; *P < 0.05, **P < 0.005, ***P < 0.001, ****P < 0.0001.

