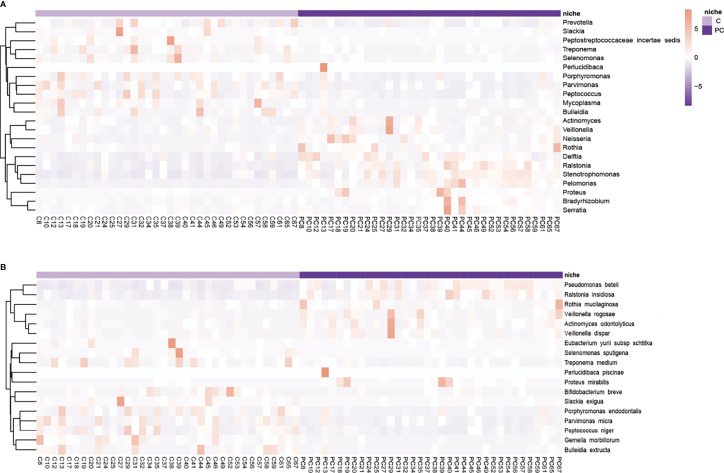
Figure 3.
Hierarchically clustered heatmap analysis of differential microflora. The (A) genera and (B) species level microbial community indicated the formation of two main clusters, separating tumor tissue and paracancerous tissue of each subject. Color key of heat map was shown on the right side of the figure. It shows microbes with high abundance in red, microbes with low abundance in purple. C, tumor tissue; PC, paracancerous tissue.

