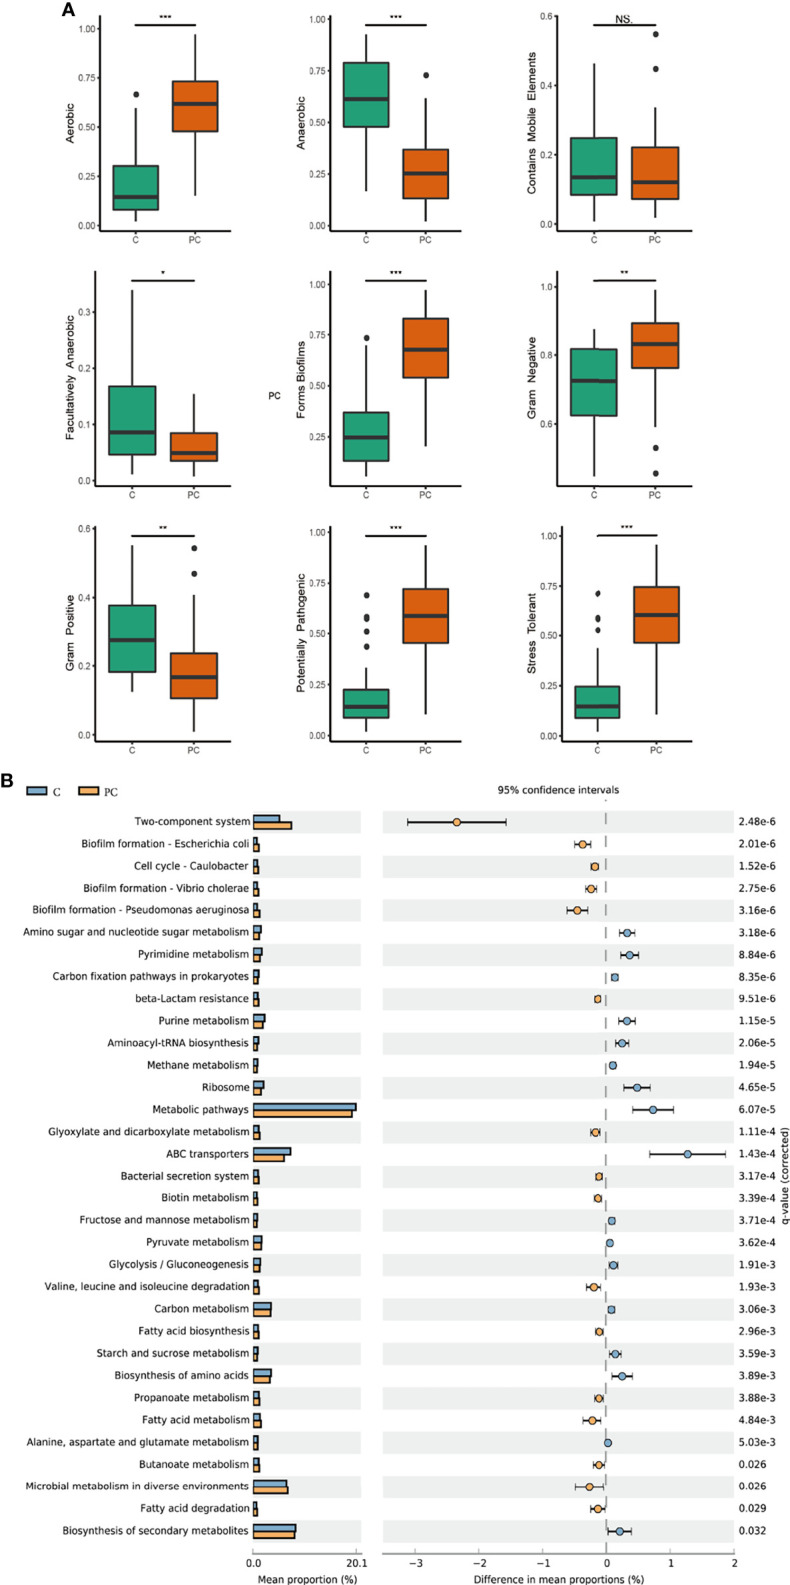
Figure 6.

Prediction of microbiome phenotypes and functions. (A) Phenotypes prediction was conducted by BugBase analysis, including gram-positive, gram-negative, biofilm forming, stress tolerance, potential pathogenicity, aerobic, anaerobic, facultatively aerobic and mobile elements. (B) Microbial functional profile was predicted by Tax4Fun2 based on the KEGG pathway, and statistically analyzed by STAMP. KEGG pathways with significant abundance difference (P < 0.05) are shown. C, tumor tissue; PC, paracancerous tissue. ns, no significance; *P < 0.05, **P < 0.005, ***P < 0.001.
